The Reports workspace allows the user to review individual, multiple or the set of pre-defined reports to assess what investigations would be useful to do within Results Visualization.
The Ribbon includes three sections:
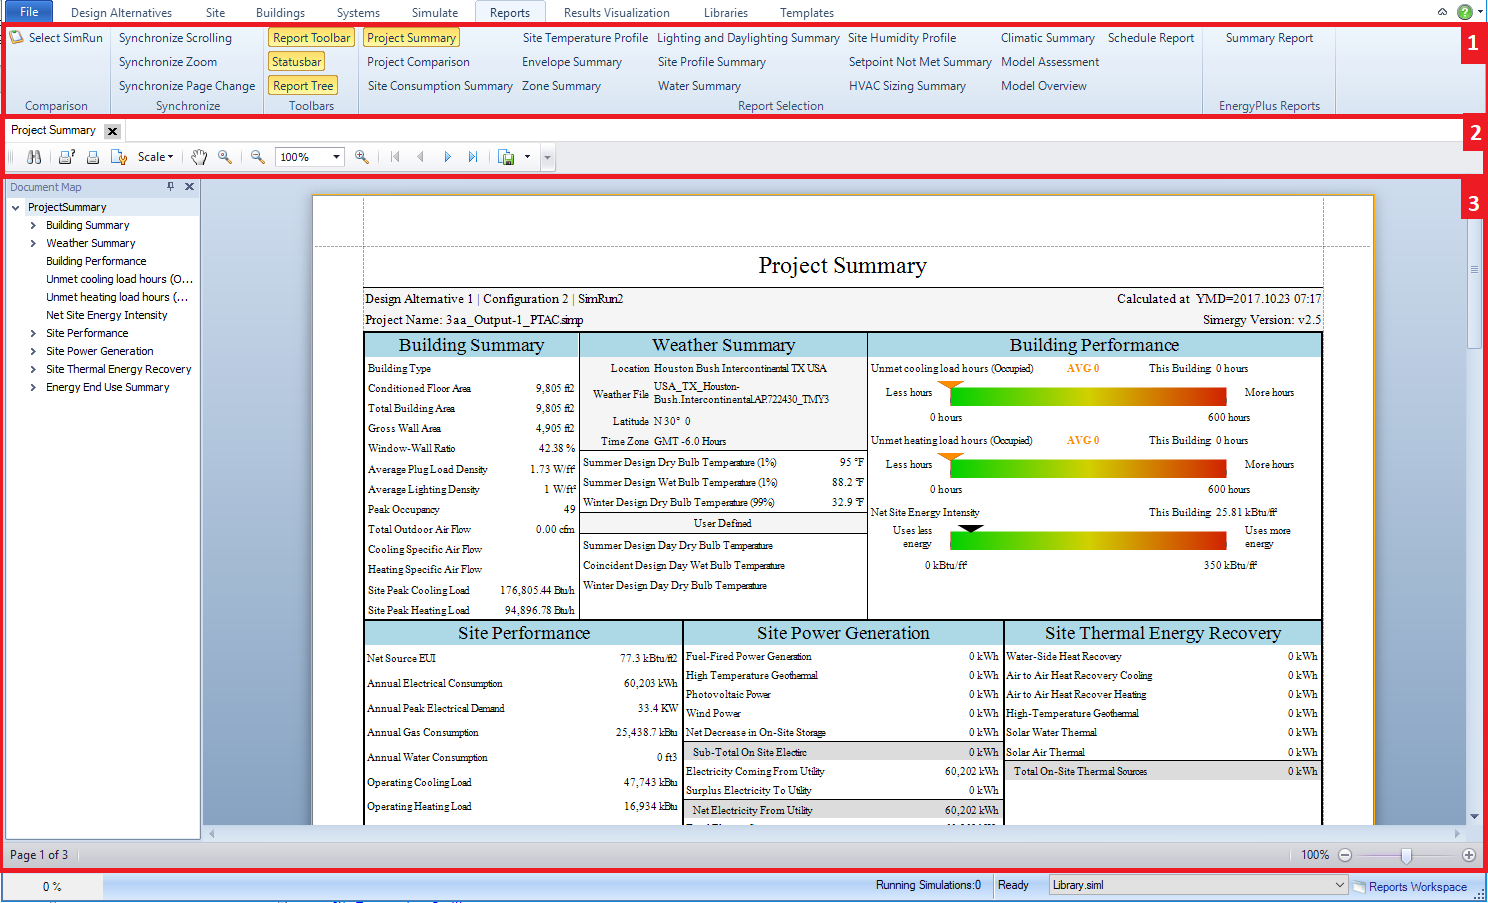
The Reports Workspace is comprised of:
1. Main Toolbar - allows for interaction of the Reports workspace
2. Page Toolbar - more akin to a pdf viewer, allows the user control over the viewing area
3. Report Viewing - the display area for the pre-defined reports, which are typically a combination of charts and tables, allowing the results to be represented in different ways. When multiple reports have been selected in the Report Selection Field tabs with the Report names will start to appear across the top of the workspace. If the user wants to move between reports all they need to do is select the tab to display that report.
All required output variables are in the default output request set that is included with each simulation. The intent of the reports set is to provide a quick and structured way to review results to assess the BEM performance and to identify other areas that warrant further investigation within Results Visualization. The results are presented in the reports in both graph and tabular form to increase their potential for use by different types of users. The reports can be exported in a number of different formats.
The following is a list of the report types that are available and links to their descriptions:
______________________________________________________________________________________
© Copyright 2013 Simergy, Sustainable IQ, Inc.