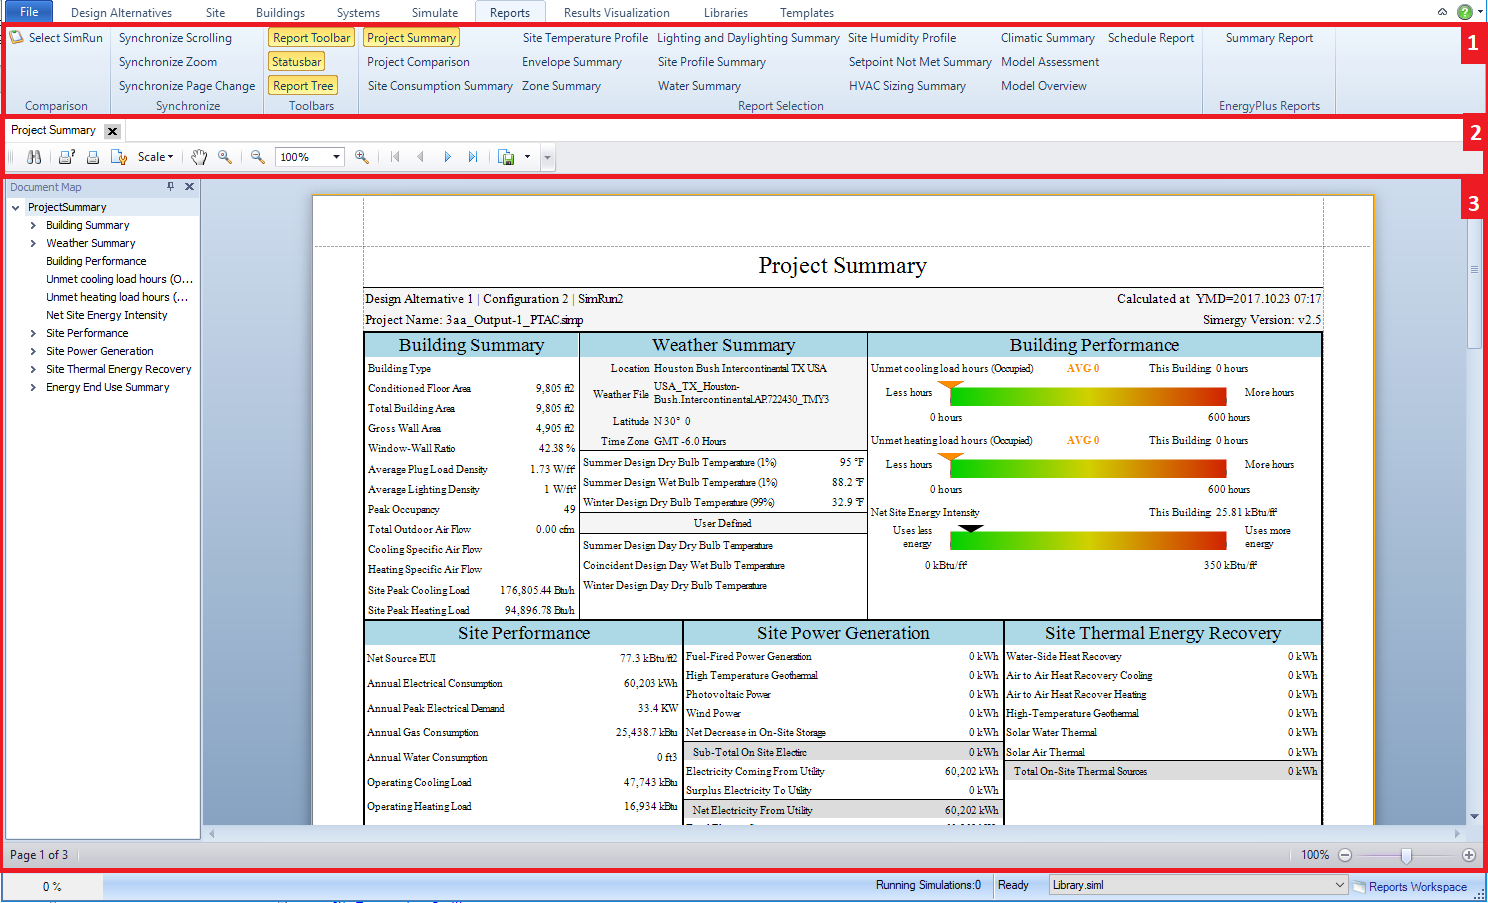
Workspace: Reports
The Reports workspace allows the user to review individual, multiple or the set of pre-defined reports to assess what investigations would be useful to do within Results Visualization.
To switch units for the Reports you will need to do the following:
File > Options > User Interface Measure Units - select the radio button at the top for either SI Units or Imperial Units. Select Save and Close.
Refresh Reports: The Reports will not automatically update, they need to be refreshed, which can be done by closing any open reports and re-opening them - they will re-generate and display the desired units. If the Report Type was not previously selected, just opening the report will display the Report Type in the correct units.
Clicking "Select SimRun" will open a window with a tree diagram of all Sim Runs from the current file - including those from other configurations and design alternative. Each SimRun has a check box, each SimRun that is enabled will have a separate set of reports added to the Report Viewer. Disable a SimRun to remove its results from the viewer.
The synchronize features allow users viewing multiple reports to move consistently among the set when the features are engaged. The user can tell if any of the synchronize features are turned on, because they will remain highlighted. The default setting is off.
When more than one report is active and Synchronize Scrolling is selected ,then when the user scrolls on one report it will be applied to all the actively viewed reports.
When more than one report is active and Synchronize Zoom is engaged then however the zoom tools are utilized by the user will be applied to all the actively viewed reports.
When more than one report is active and Synchronize Page Change is selected , then when the user changes the page on one report it will be applied to all the actively viewed reports.
The three buttons function as on/off toggles for different capabilities for the reports shown in the reports viewing area. By default they are selected (highlighted).
When activated the Report Toolbar is displayed at the top of the Results Viewing Area, and once selected the ribbon button will remain highlighted. The Report Toolbar enables zooming, panning, printing and other capabilities.
When activated the Status Bar is displayed at the bottom of the Results Viewing Area. On the left side it identifies the current page number of the report that the user is on as well as the total number of pages. On the right side is a zoom slider bar that also displays the current zoom percentage. The slider bar is set up so that sliding towards the left zooms out and sliding towards the right zooms in.
When activated (button highlighted in the ribbon) the Report Tree appears on the left side of the Results Viewing Area. The Report Tree provides a document map (tree) for each report that highlights main topic areas and expands to the level of the individual output variables. Selecting an output variable or a topic in the Report Tree will highlight its location on the active report. Each report has a different document map, and for the larger reports, such as the Project Summary and the Envelope summary the Report Tree can be an effective way to navigate the reports.
The Report Tree can be closed by selecting the ‘x’ in the upper right corner or by deselecting Report Tree from the Ribbon.
The active Results Sets are displayed in the ribbon toolbar (area 1) for quick reference and selection. By default when the user completes a simulation and selects ‘View Results’ on the Simulate workspace the Project Summary will be active. The user can easily select additional Results Sets or change the active Result Set by selecting the Result Set Feature from the ribbon toolbar. Each time a Report Selection is made the instance of that report appears in the Results Viewing Area and a tab with the Report Name appears above the Report Toolbar. The user can view different reports by selecting on the tabs, and they can also close the Report by selecting the ‘x’ on the tab.
A standard set of Report Options are presented to the user, which they can view by selecting the checkbox or they can close by deselecting. The Report Options include:
Project Summary
Site Consumption Summary
Site Temperature Profile
Envelope Summary
Zone Summary
Lighting and Daylighting Summary
Site Profile
Water Summary
Site Humidity Profile
Setpoint Not Met Summary
HVAC Sizing Summary
Climatic Summary
Model Assessment
Model Overview
Schedule Report
Energy Plus Summary Report
The viewing area for single and multiple reports. Up to four reports can be viewed side by side when the user adds comparisons. The user can view different reports by selecting them from the Report Selection list or if they have already been selected, the user can select on the different Report Type tabs above the Results Viewing Area.
______________________________________________________________________________________
© Copyright 2013 Simergy, Sustainable IQ, Inc.