Workspace: Reports/Toolbars/Report Toolbar
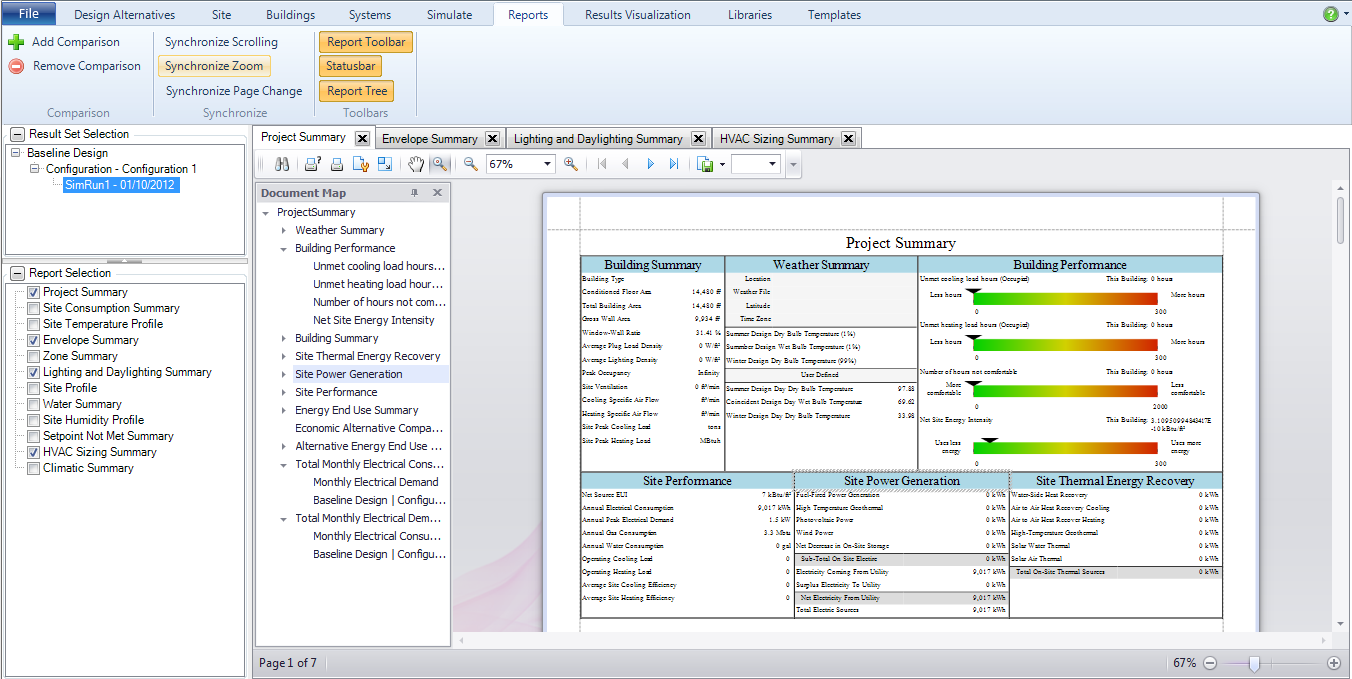
The Project Summary report provides an overview of the results for relevant topics to quickly assess performance and identify areas for further investigation. The topics included are:
Site Performance
Reports on general statistics for the building as well as specific air flow and peak cooling and heating loads. The output variables included:
Building Type
Conditioned Floor Area (m² - ft²)
Total Building Area (m² - ft²)
Gross Wall Area (m² - ft²)
Window-Wall Ratio (% - %)
Average Plug Load Density (W/m² - W/ft²)
Average Lighting Density (W/m² - W/ft²)
Peak Occupancy (People)
Total Outdoor Airflow (m³/s - ft³/min)
Cooling specific Air Flow
Heating Specific Air Flow
Site Peak Cooling Load
Site Peak Heating Load
Provides the basics on the weather file and both the typical (1%) Summer Design Temperature and (99%) Winter Design Temperature and the User Defined set for the values, so that they can be visualized side by side. The output variables included are:
Location
Weather file
Latitude
Longitude
Time Zone
Summer design DB temperature (1%)
Summer design WB temperature (1%)
Winter design DB temperature (99%)
User Defined Summer design day DB temp
User Defined Coincident design day WB temp
Provides four bars where the simulated performance is plotted on each, with a quantified value, so that not only can the user see the outcome for each of the four parameters, but how they compare to each other as well. The output variables included are:
Unmet cooling load hours (hrs - hrs)
Unmet heating load hours (hrs - hrs)
# of hours not comfortable (Simple ASHRAE Std 55) (hrs - hrs)
Net Site Energy Intensity : (kWh/m² - kBtu/ft²)
The output variables included are:
Net Source Energy Use Intensity (EUI) (kWh/m² - kBtu/ft²)
Annual Electrical Consumption (kWh - kWh)
Annual Peak Electrical Demand (kW - kW)
Annual Gas Consumption (GJ - Mbtu)
Annual Water Consumption (m³ - gal)
Operating Cooling Load
Operating Heating Load
The output variables included are:
Fuel-Fired Power Generation (kWh - kWh)
High Temperature Geothermal (kWh - kWh)
Photovoltaic Power (kWh - kWh)
Wind Power (kWh - kWh)
Net Decrease in On-Site Storage (kWh - kWh)
Sub-Total On-Site Electric (kWh - kWh)
Electricity Coming From Utility (kWh - kWh)
Surplus Electricity To Utility (kWh - kWh)
Net Electricity From Utility (kWh - kWh)
Total Electric Sources (kWh - kWh)
The output variables included are:
Water-Side Heat Recovery (kWh - kWh)
Air to Air Heat Recovery for Cooling (kWh - kWh)
Air to Air Heat Recovery for Heating (kWh - kWh)
High-Temperature Geothermal* (kWh - kWh)
Solar Water Thermal (kWh - kWh)
Solar Air Thermal (kWh - kWh)
Total On-Site Thermal Sources (kWh - kWh)
Provides a visual breakdown and percentage label for the different categories of each topic
Presents a pie chart of the output variable values presented on Page 1. The simulated results for Site Power Generation for the BEM = 100%, and the contribution that each output variable within that topic that contributes to that 100% value is shown as a piece of the pie.
Presents a pie chart of the output variable values presented on Page 1. The simulated results for Site Thermal Energy Recovery for the BEM = 100%, and the contribution that each output variable within that topic that contributes to that 100% value is shown as a piece of the pie.
A table displaying the energy end use values and a pie chart showing the percentage contribution of the energy end uses to the 100% Electricity Total.
The output variables included are:
Cooling (kWh-kWh)
Heating (GJ-MBtu)
Heat Rejection (GJ-MBtu)
Fans (GJ-MBtu)
Pumps (MJ/m²-kBtu/ft²)
Humidification
Heat Recovery
Interior Equipment
Exterior Equipment
Interior Lighting
Exterior Lighting
Water Systems
Refrigeration
Site Power Generation
A column chart that shows side by side the simulation results for multiple sim runs for the parameters:
A table that shows multiple simulation runs being compared as rows and the four parameters each as a column.
The output variables included are:
Row Headers
Grand Total
Space Cooling
Space Heating
Heat Rejection
Fans
Pumps
Humidification
Heat Recovery
Interior Receptacles
Exterior Receptacles
Interior Lighting
Exterior Lighting
Service Water Heating
Refrigeration
Site Power Generation
______________________________________________________________________________________
© Copyright 2013 Simergy, Sustainable IQ, Inc.