Workspace = Reports
Related Topics: Reports Features, Reports Toolbar
The Lighting and Daylighting Summary Report contains three main sections:
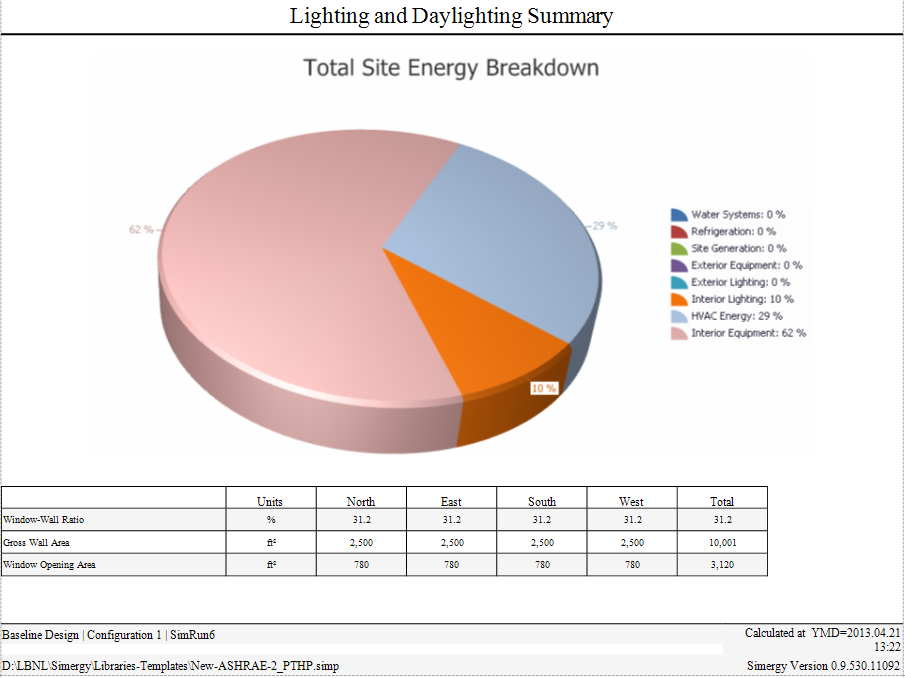
Total Site Energy Breakdown Pie Chart and Envelope table
The Interior and Exterior Lighting Consumption table
The thermal zone lighting and daylighting table.
A pie chart of the total site energy breakdown is the first thing you will see. The intent is to provide context on what the interior lighting and exterior lighting consumption levels are compared to the other site energy components for the project. The table below the pie chart provides additional context by providing the window to wall ratio, the gross wall area and the window opening area.
The table provides feedback on five key metrics for both Interior and Exterior Lighting
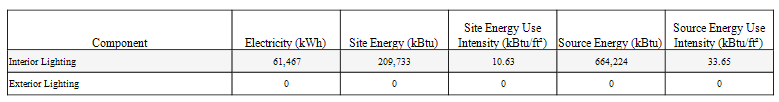
Reports the electricity consumed related to interior and exterior lighting for the time period simulated
Energy used at Site
Energy Used at Site per floor area
Energy Used at the Source (including transmission losses)
Energy Used at the Source per floor area (including transmission losses)
The table contains a row for each thermal zone and identifies key properties that assist you to quickly review the lighting values for the thermal zone and the source for the values
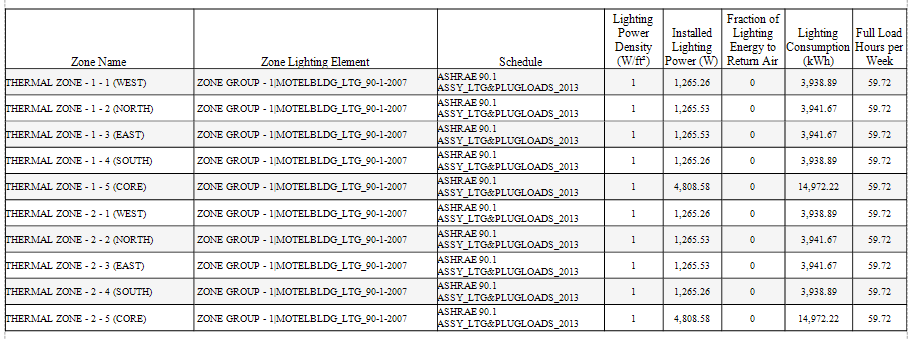
Identifies the names of all the thermal zones that were included in the simulation
Identifies the library entry source for the lighting input values associated with each thermal zone. The source and application hierarchy are as follows:
identifies the schedule that is associated with the Zone Lighting library entry which influences the lighting consumption. The source and application hierarchy are as follows:
Reports the lighting power density value that has been included on the library entry (Libraries>Internal Loads>Lighting (type).
The resulting installed lighting power based on the lighting power density and the area associated with the thermal zone.
The fraction of heat emitted from lights that is lost to return air due to the proximity of the lights to the return air outlets.
The overall lighting energy consumption for the period that was analyzed. It is based on the LPD, thermal zone area, lighting schedule and other factors
The amount of hours per week that the lighting is at 100% of the lighting power density based on the lighting schedule.
______________________________________________________________________________________
© Copyright 2013 Simergy, Sustainable IQ, Inc.