Workspace = Reports
Related Topics: Reports Features, Reports Toolbar
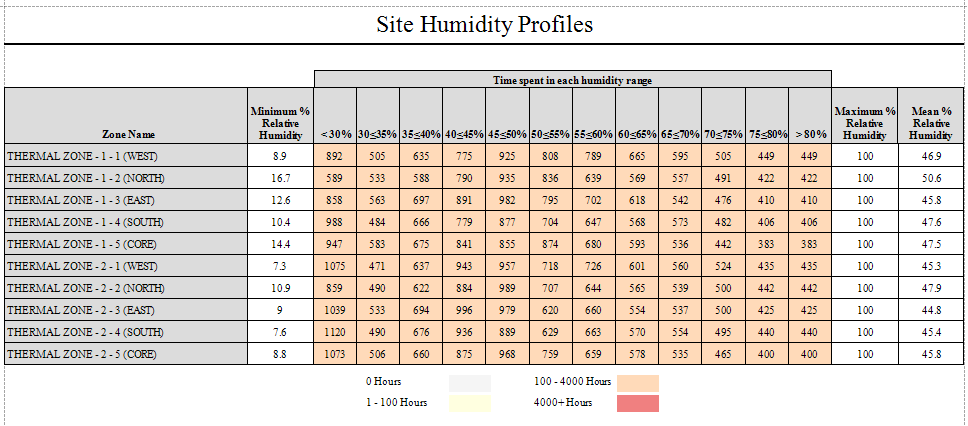
The report is a table that displays the yearly hours spent within a certain humidity range for each occupied zone simulated in the energy model. The left side of the table reports the Minimum % Relative Humidity, while the columns on the right side report the Maximum % Relative Humidity and the Mean % Relative Humidity. The main cells of the table within the "Tim Spent in each humidity range" report the number of hours for the simulated range that fall in that discreet range. Each column reports a 5% range starting at <30% and going up to >80%. The cells are conditionally formatted to highlight different ranges of hour totals, so that by quickly scanning the user can identify the zones that are potentially influencing the results positively or negatively. The four hour ranges are 0 hours, 1-100 hours, 100-4,000 hours and 4,000+ hours.
______________________________________________________________________________________
© Copyright 2013 Simergy, Sustainable IQ, Inc.