Case Study 2: Mixed-Use Building B
Description: A mixed-use building project with (2) stories of underground parking, (2) stories of retail, and (4) stories of office space. Each occupancy (parking, retail, office) is modeled as a Building Sections (two sections for the separate retail blocks). Each section references the appropriate Loads & Conditions template for that occupancy
HVAC Systems: Heating and cooling is provided by Ground-Source Heat Pumps (one for each section). Air handling is de-centralized and done by these Unitary Heat Pump air delivery to the zones
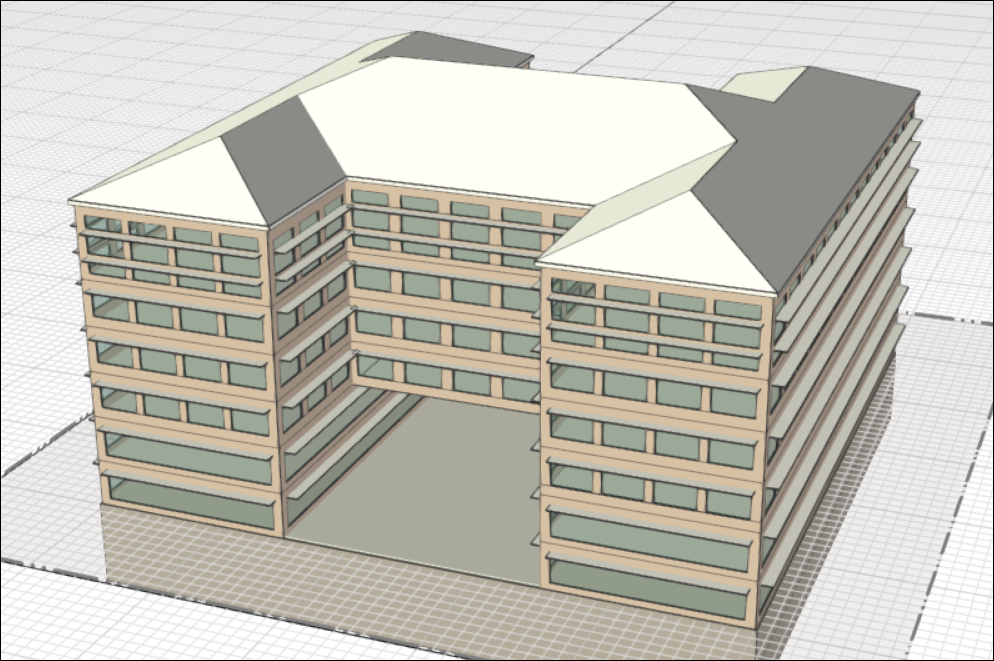
Figure 1: 3D view of the building geometry
Internal loads: The lower four stories are office spaces and thus assigned office templates for zone loads and conditions, the upper two stories are hotel floors for the good view around with the respective templates.
| Internal load type | Value | Weekday | Saturday | Sunday |
| People | 13.93 m2/person 149.94 ft2/person |
 |
 |
 |
| Lights | 10.76 W/m2 1.0 W/ft2 |
 |
 |
 |
| Electrical Equip. | 8.61 W/m2 0.8 W/ft2 |
 |
 |
 |
| Internal load type | Value | Weekday | Saturday | Sunday |
| People | 18.58 m2/person 200 ft2/person |
 |
 |
 |
| Lights | 10.76 W/m2 1.0 W/ft2 |
 |
 |
 |
| Electrical Equip. | 13.56 W/m2 1.26 W/ft2 |
 |
 |
 |
| Thermostat type | Min/Avg/Max | Weekday | Saturday | Sunday |
| Heating Schedule | 15.6/18.4/21.1 C 60.0/65.8/70.0 F |
 |
 |
 |
| Cooling Schedule | 23.9/26.3/29.4 C 75.0/79.3/85.0 F |
 |
 |
 |
| Thermostat type | Min/Avg/Max | Weekday | Saturday | Sunday |
| Heating Schedule | ?? C -76/2.9/69.8 F |
 |
|
|
| Cooling Schedule | ?? C 75.2/220/392 F |
|
|
|
HVAC: Ground source water to air heat pump system.
| Zone HVAC | 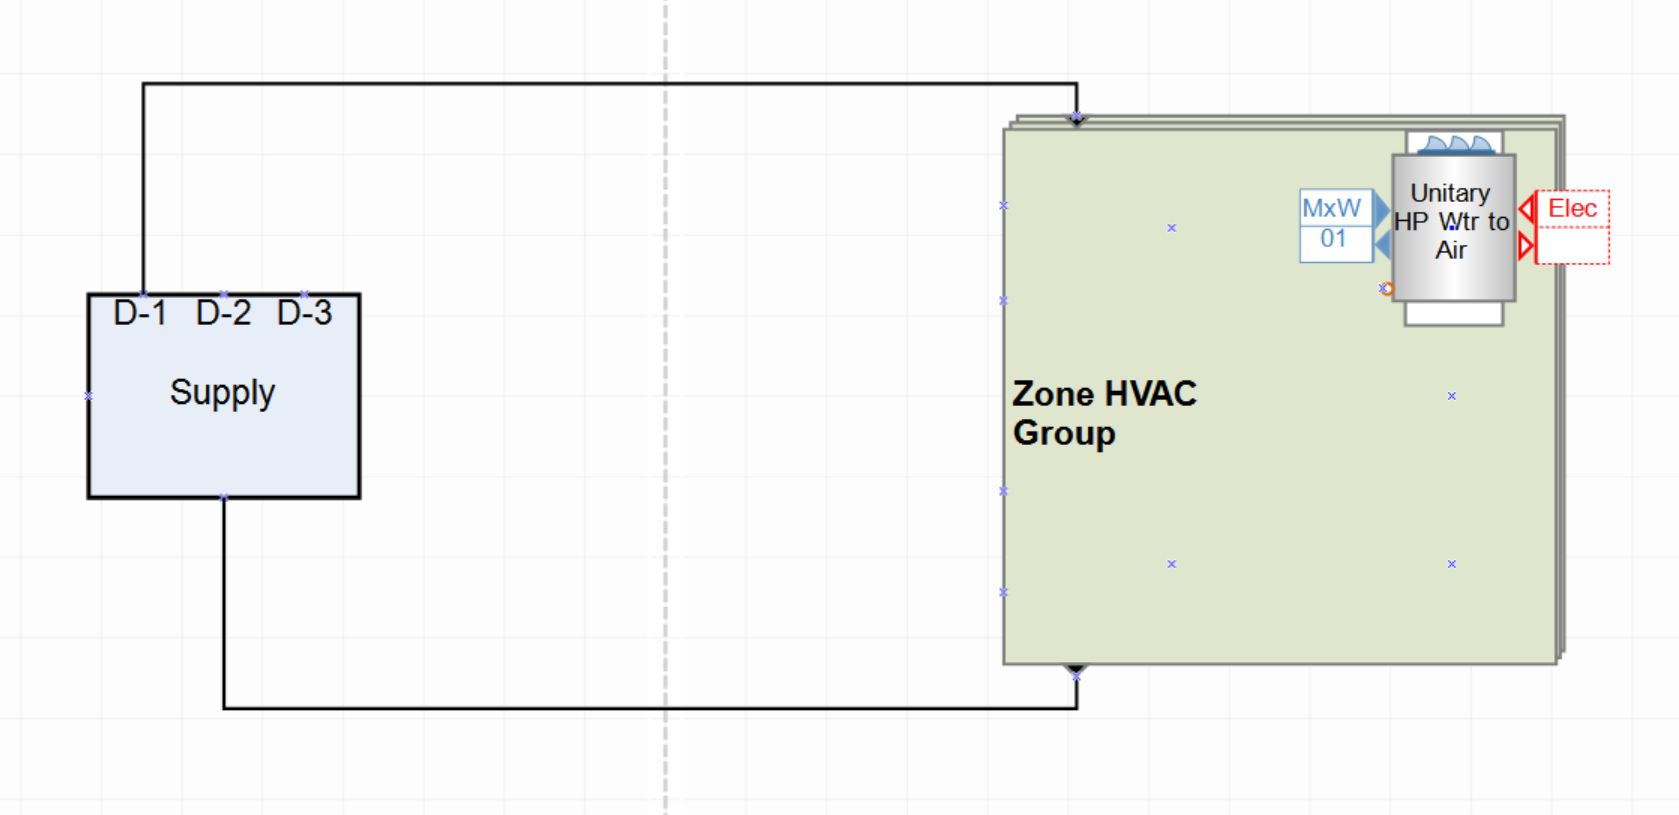 |
Mixed water | 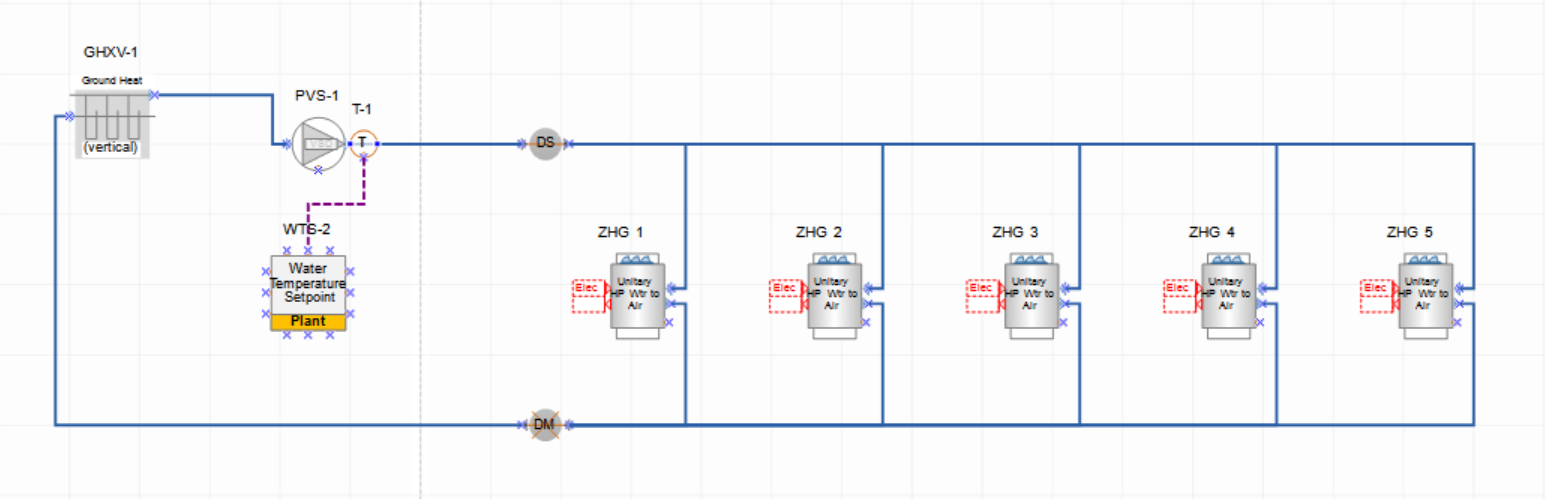 |
Figure 2: Zone HVAC group and mixed water diagram overview (click any image to enlarge)
Control and temperatures: The mixed water temperature setpoint is following a deep ground temperature with a 0 C (32 F) setpoint difference between 10 C (50 F) and 80 C (176 F).
Results: compared to an ASHRAE-7 system (VAV reheat air terminals with water based cooling and heating, hot water loop with 2 boilers, chilled water loop with two chillers and a condenser loop with 2 cooling towers).The first report comparison details the end use summary in comparison between the two design alternatives. One can see that the Total Energy End Use shows a nice difference between the two systems.
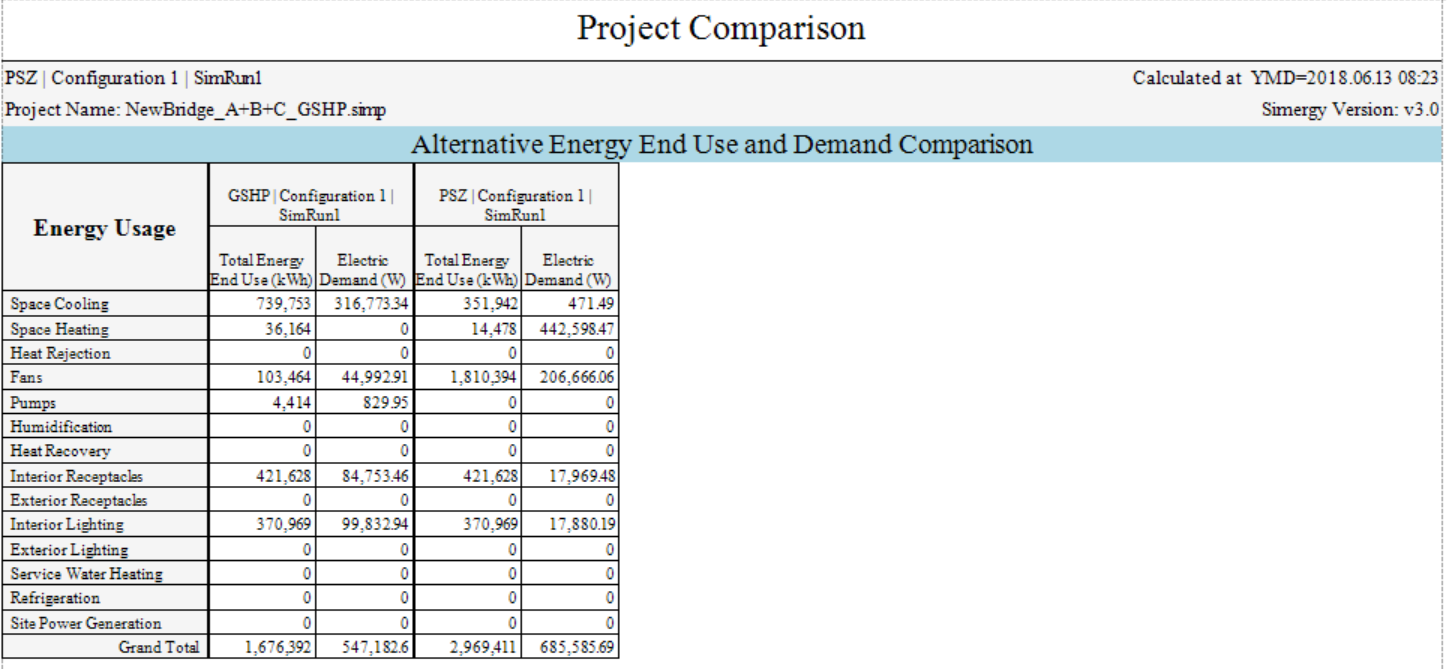
Figure 3: Comparing Project Comparison Report
The next graph compares the cooling, heating and fan electricity between the two design alternatives. The upper left graph shows the heating electricity and the upper right graph show the cooling electricity in a scatter plot over outside air temperature. Both show that the GSHP does more cooling and a little bit more heating. However in the lower graph one can see that the fan electricity is significantly higher for the PSZ alternative than the GSHP alternative.
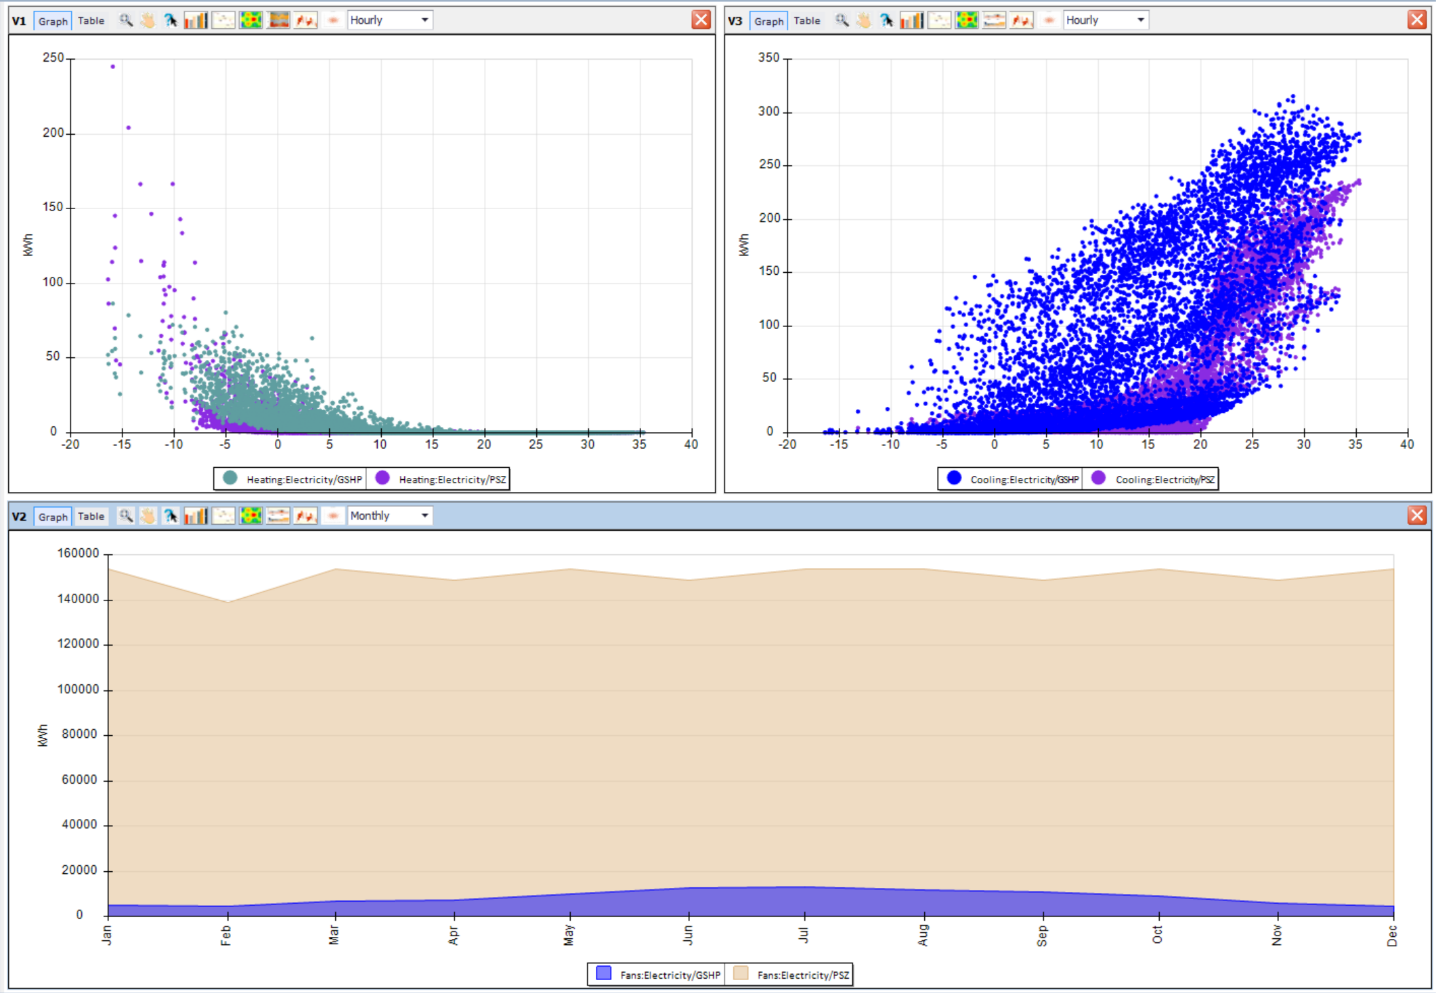
Figure 4: Cooling and heating energy monthly and Zone Air Temperature of a specific zone in context of the heating and cooling setpoint temperatures.
DisplayOrder: 2