The Results Visualization workspace (ResViz) allows the user to interrogate the output variables that were included in the Output Request Set (OPR) that was selected/defined pre-simulation and visualize and investigate the results in a number of ways. The user can set up views in any of a number of different chart types or they can view the results in tabular format. Sets of 1-4 views can be saved as a Results Screen to be revisited for this project at a later time or the view set can be saved as a Results Screen Template and used across multiple projects. In addition, a set of Results Screen Templates are included with Simergy, so that users can utilize them as a starting point for viewing results.
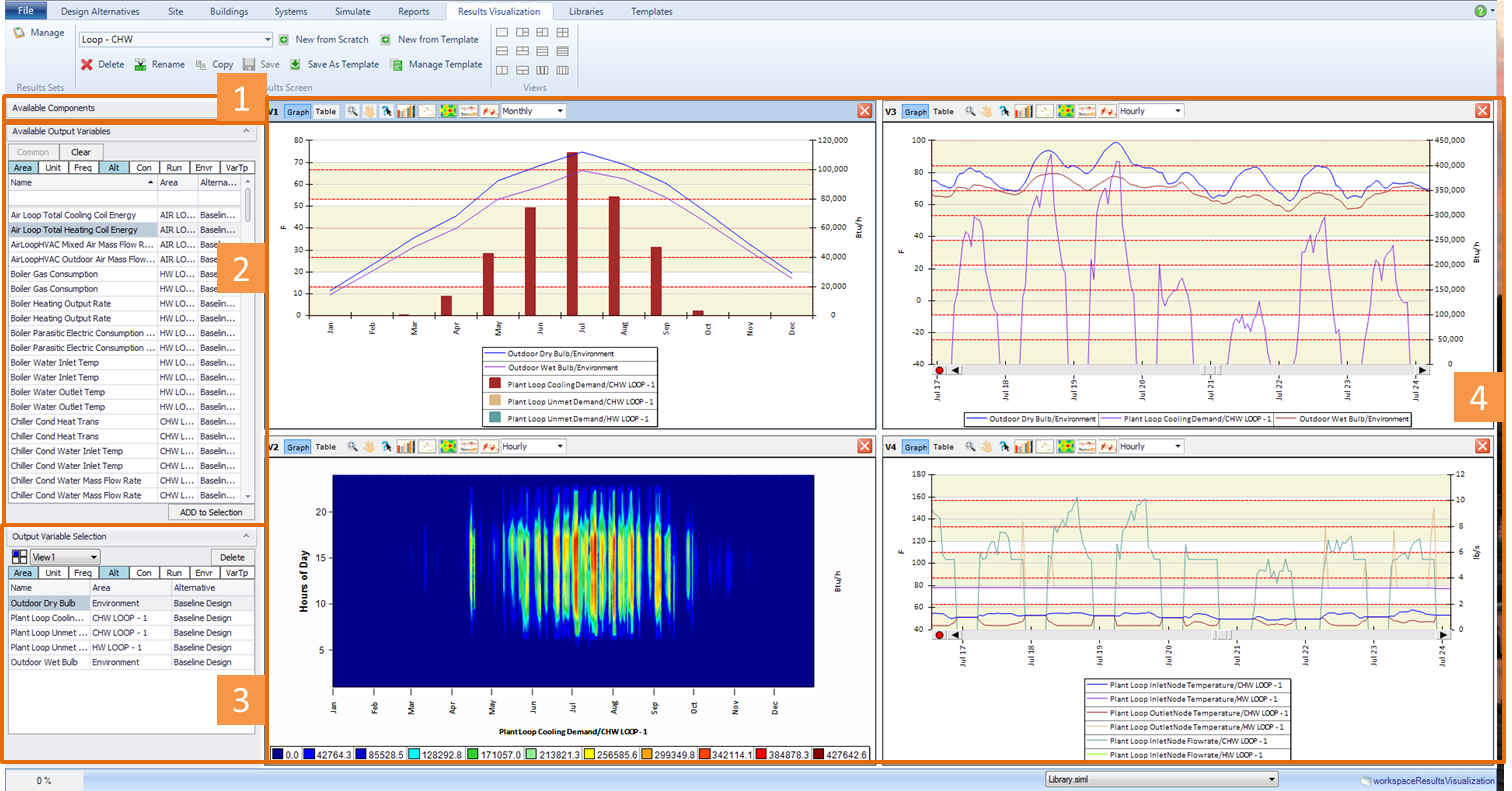
The Results Visualization Workspace is comprised of four fields, in addition to the Ribbon which is described below:
By default this field is compressed to provide more area for the Available Output Variables and Output Variable Selection Fields. The Component Tree allows the user to view what components are associated with the Zone HVAC Groups and the HVAC Systems including the Air and Water Loops. Depending on what Output Variables are included in the Output Request Set, the component tree can be used to filter the Output Variable set by double clicking on a component. If there are Output Variables associated with that component in the Output Request Set, then they will be displayed in the Available Output Variables table. Otherwise this table will appear empty.
Displays the Output Variables that are available to the user to incorporate into Results Views. The list is determined by the Output Variables that are defined in the Output Request Set library that is established pre-simulation. The table contains a number of ways that the Output Variables Set can be filtered, so that they can be managed by the user more effectively to obtain the desired Output Variable selection. Once identified and selected the user can then select ADD to Selection, which will add that Output Variable to the Output Variable Selection table and incorporate it into the active Results View.
Tip: Simulation time and the size of the Results file are directly affected by the number of Output Variables that are included in the OPR. This is the main reason that users do not select all of the >10,000 output variables and meters that available in EnergyPlus. It is important for the user to put some thought to what output variables they will want to investigate and interrogate in Results Visualization, so that they can include them in the Output Request Set (ORS) library. Because if the user is looking to view the results for an output variable that is not part of the ORS, then they will need to go back and add that Output Variable and rerun the simulation.
The table where the Output Variables associated with the current Results View are displayed. If there is more than one Results View the user can change the active Results View by either selecting from the drop down list above the table or selecting the view directly. Changing the active view will change the Output Variables shown in the table. The columns in the table can be varied by selecting the column headers shown below the view drop down list. The user can toggle on/off the columns displayed in the table below by either selecting (colored) or deselecting the column header. In addition, the user can delete Output Variables from the table and ultimately the current view by selecting the output variable and then selecting delete.
The Results View field can be configured in a number of different combinations of 1 to 4 views based on the view configuration icon that has been selected from the ribbon. For each view the user has the ability to view it as either a chart or a graph. The format and appearance properties can be accessed by having the mouse located within the view and right clicking and selecting properties. The user has a number of edge controls on each view that allow them to zoom, pan, data track, change the chart type (9 options) and change the frequency displayed (5 options).
Tip: Any information displayed in a Results View can be captured and/or exported by moving the mouse into the view and right clicking to access the Export, Copy and Print capabilities
The Ribbon includes three sections (although the areas of the workspace do not change)
A pop-up dialog box that allows the user to select which simulation runs (Simulation Configurations) they want to view the output variables for. Once a Results Set is selected the Output Variables associated with it are added to the Available Output Variables table, which is the source for Output Variables that can be selected, which adds them to the Output Variable Selection and to the current view. The Manage Result Sets dialog box remains open until you close it. Therefore, you can select and deselect Results Sets at any time while working within Results Visualization.
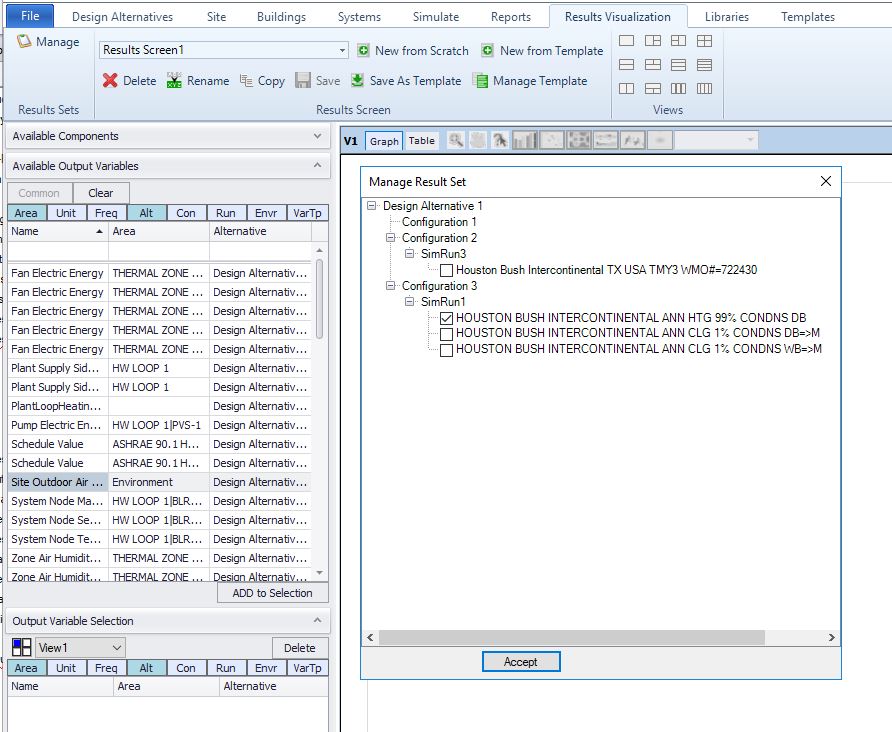
Figure - Shows the Manage Results Set pop-up dialog that appears when Manage is selected. By selecting the checkbox next to each of the available options that Result Set will be active and the Output Variables available within Results Visualization.
You can confirm which Results Sets are active by selecting the Configuration (Con) and SimRun (Run) to be displayed in the Available Output Variables Table
When you deselect a Results Set the following will occur:
The available Results Screen Template selections active for this model. If the user is visiting the ResViz workspace for the first time for a model the default in this field will be Results Screen 1, and other options will not be available from the drop down list. By selecting different Results Screens the information shown in the different fields and views within the workspace will change.
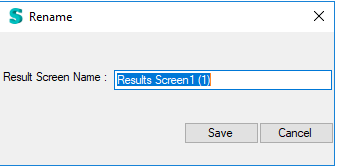
A pop-up dialog box that allows the user to change the name of the current Results Screen. After edits are completed and Save is selected the new name will be displayed in the Results Screen Options field.
Allows the user to delete the current Results Screen from the model.
Note: If a Result Screen Template has been used as a starting point for a Results Screen and then saved as a Results Screen, if it is deleted only the Results Screen is deleted from the model, the Results Screen Template is not deleted.
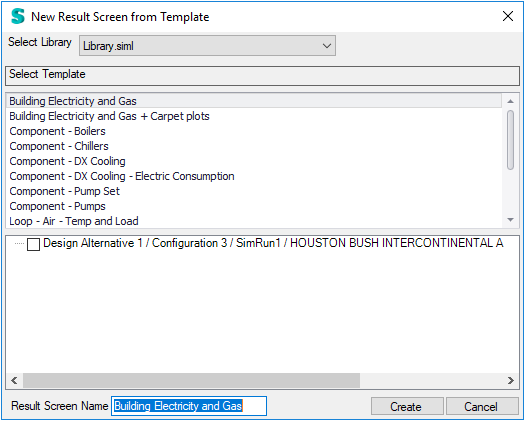
A pop-up dialog that provides the user three options as a starting point for creating the Result Screen, which include starting with a Empty Result Screen, Create from a Result Screen Template or Create from an existing Result Screen. Selecting either the second or third option (shown below) provides a list of the available options for selection. In addition, the user can define the name for the new Result Screen.
Makes a copy of the current Results Screen. The copy becomes the current Results Screen and the new name shown in the Results Screen Options field is the previous Results Screen name prefaced by "Copy of". The name can be changed by selecting Rename. If the user selects the arrow to expose the drop down list for the Results Screen Options field they will see the previous Results Screen is part of the list.
Saves changes made to the current Results Screen.
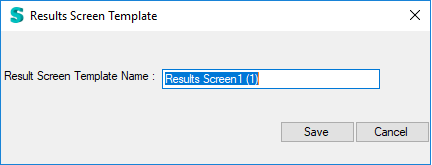
A pop-up dialog that allows the user to save the current Results Screen as a Results Screen Template enabling it to be saved to the Library and used across multiple projects.
Note: For a Results Screen Template to be 'Fully Active' within another project the Output Variables that are part of the saved views will need to be in the Output Request Set for the other models.
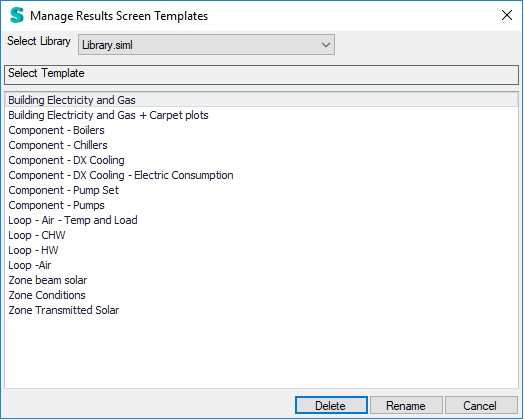
Provides the user the ability to change Libraries without going to File/Options, so that they can access Results Screen Templates that they may want to use that are associated with different Libraries. The Select Library drop down list will present the user the four options for Libraries that have been selected in the File/Options Dialog and the option to select Project Model. When a Library has been selected the Results Screen Templates that are available are displayed. The user can Rename or Delete the Results Screen Template within this dialog, but they cannot select it to include in the project. To do that the user selects New and they select Create from Result Screen Template in the dialog the list of Results Screen Templates that was shown in the Manage Template dialog will be displayed and can be selected.
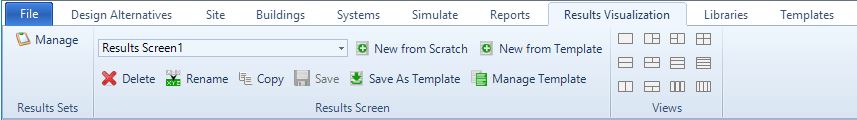
View Configuration Icons - The twelve view configuration options provide the user the ability to shape the Results View Field in a number of different ways utilizing one to four views.
______________________________________________________________________________________
© Copyright 2013 Simergy, Sustainable IQ, Inc.