Tip: Remember the flow to incorporate Output Variables in Results Views:
The two buttons that allow the user to switch the results view from graph to table or vice versa. The default for all results views is graph.
The combination of Data Zoom with the Results View Controls provide a number of zoom features to the user.
The example walks through the different features that can be used in a number of different combination.
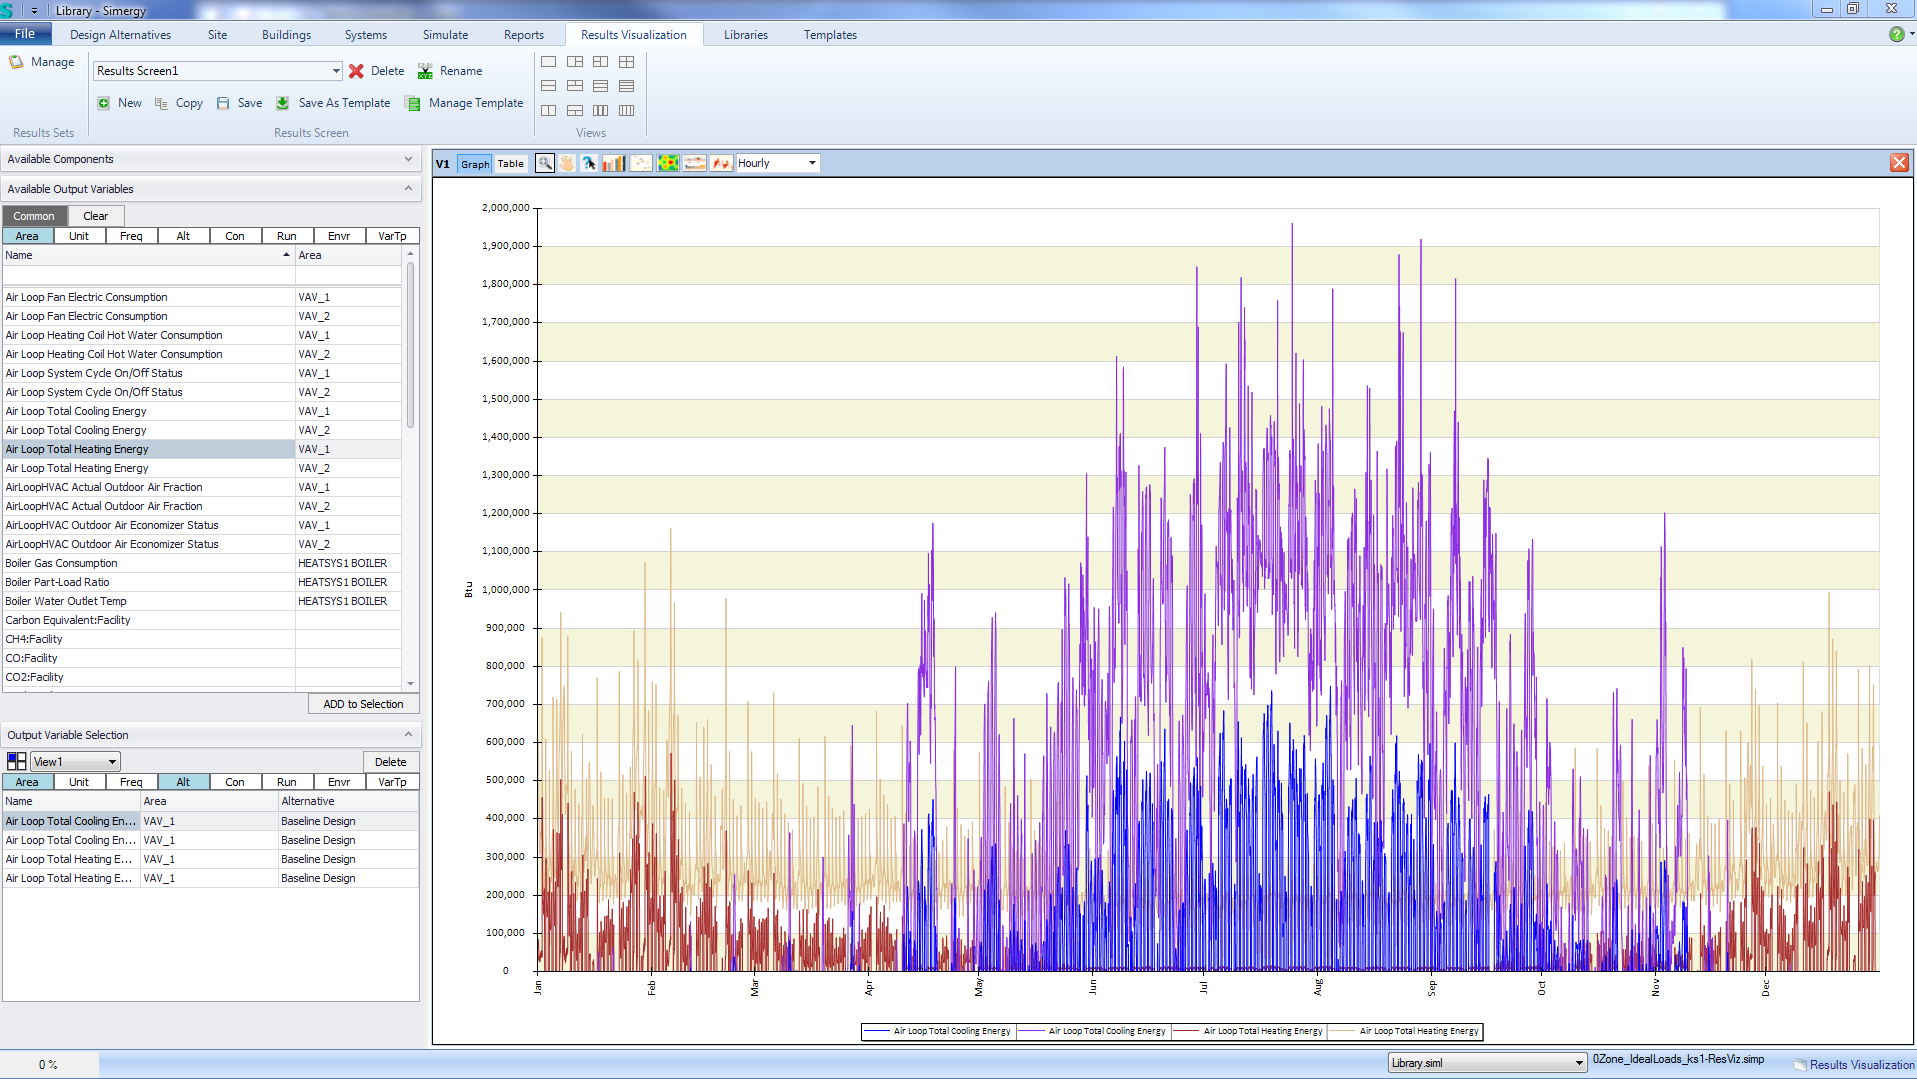
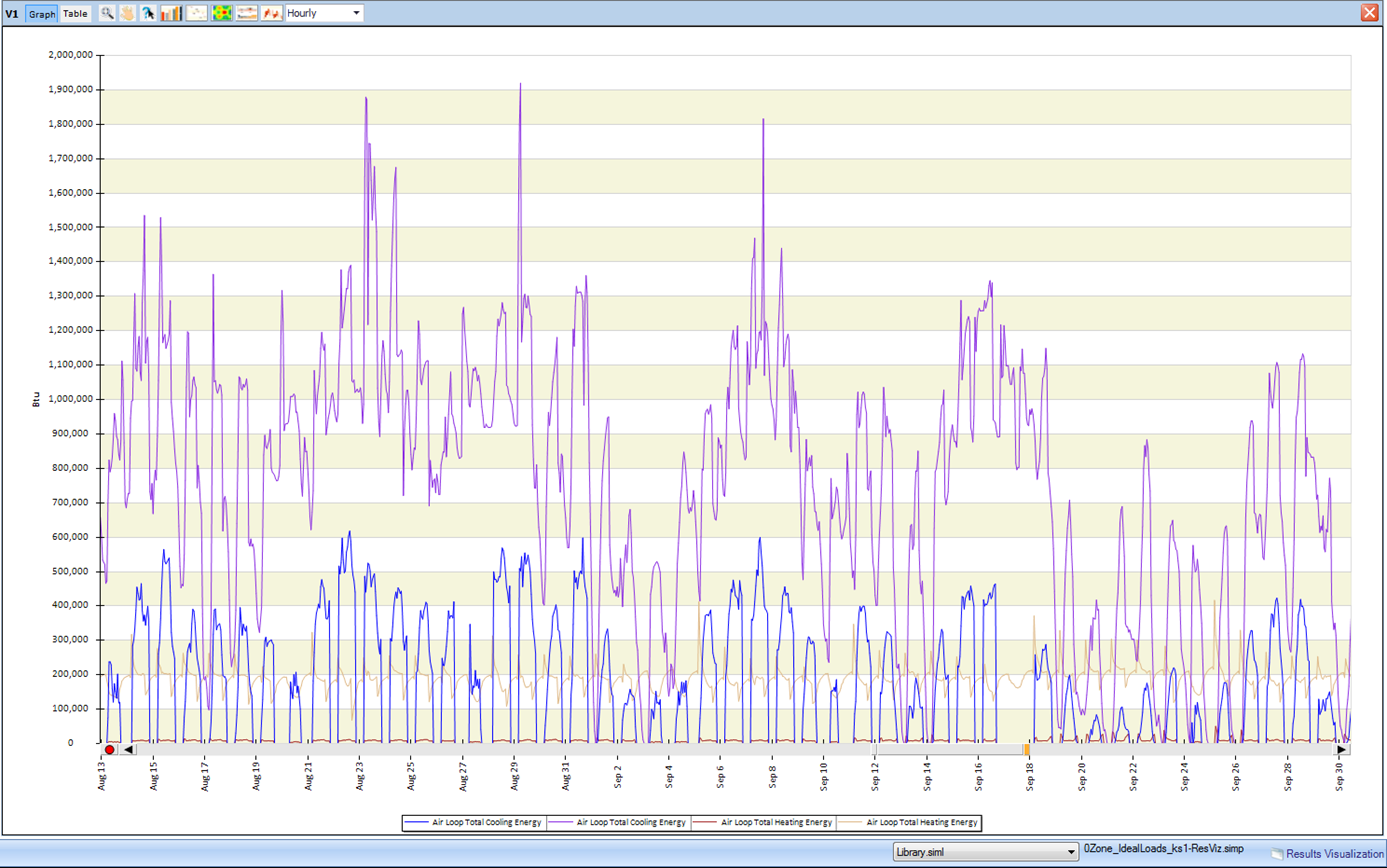
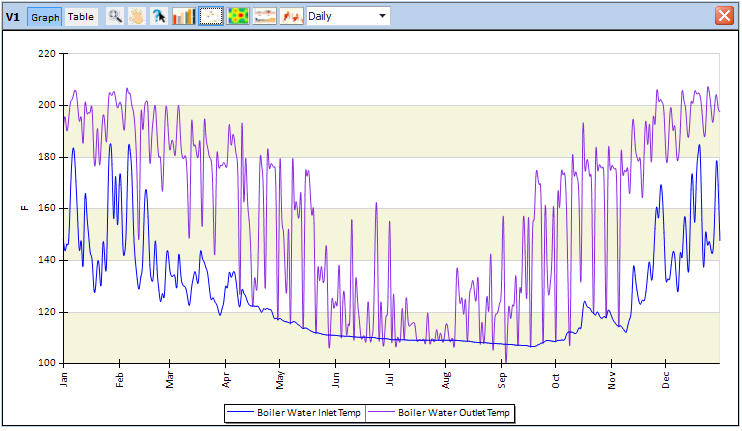
Example: the user has set up a Results View showing four output variables, which are the Air Loop Total Heating and Cooling Energy associated with two Results Sets. The view shown is the default hourly, line graph results view.
Selecting the data zoom icon, the user can select a range of months to highlight. The example below shows a selection from Mid February to late May. The area being selected will be highlighted in gray.
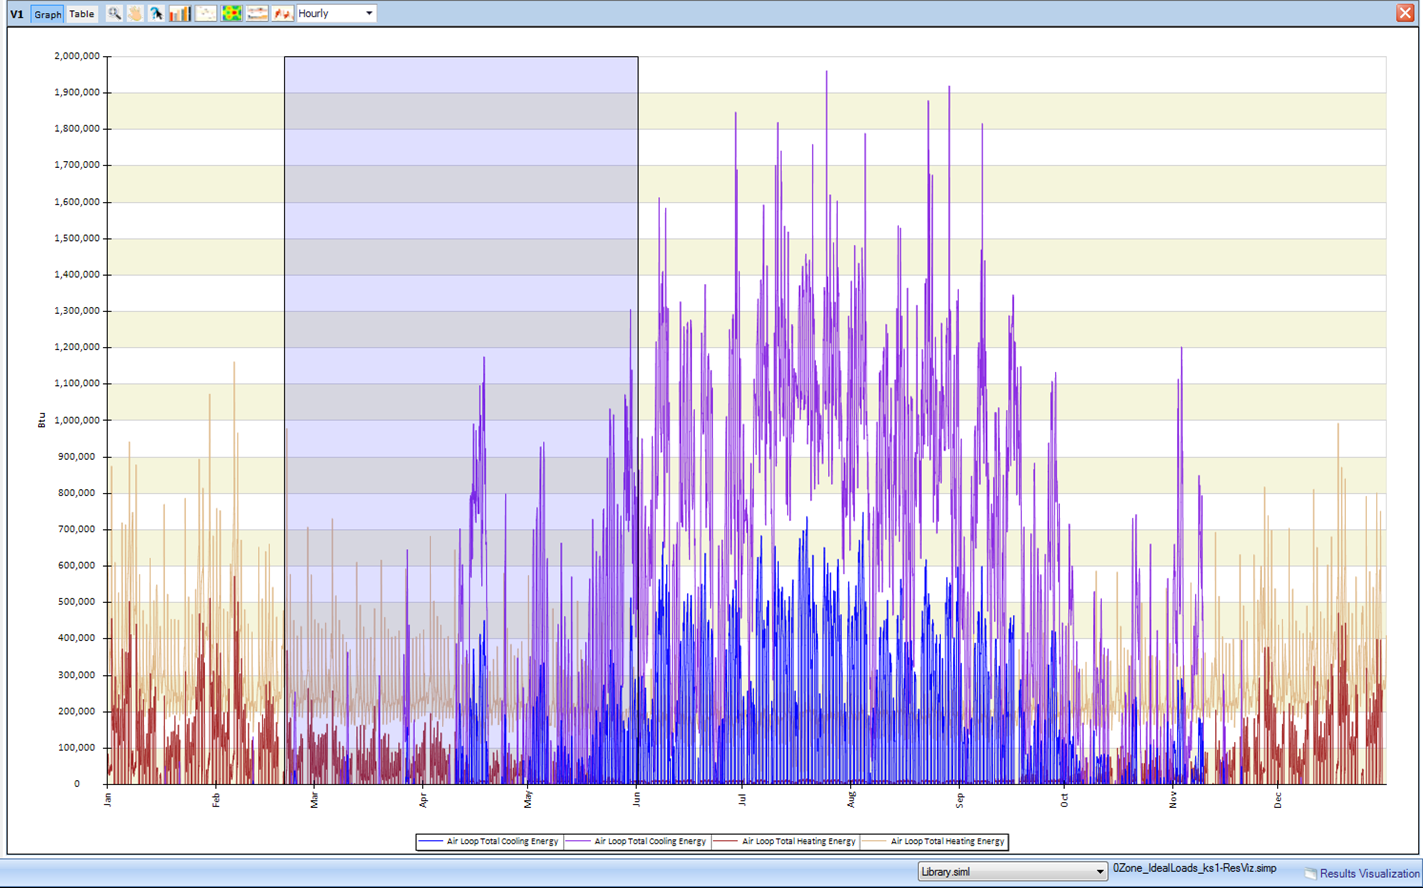
When the mouse is released the range selection is determined, and the results view of that selection will be displayed.
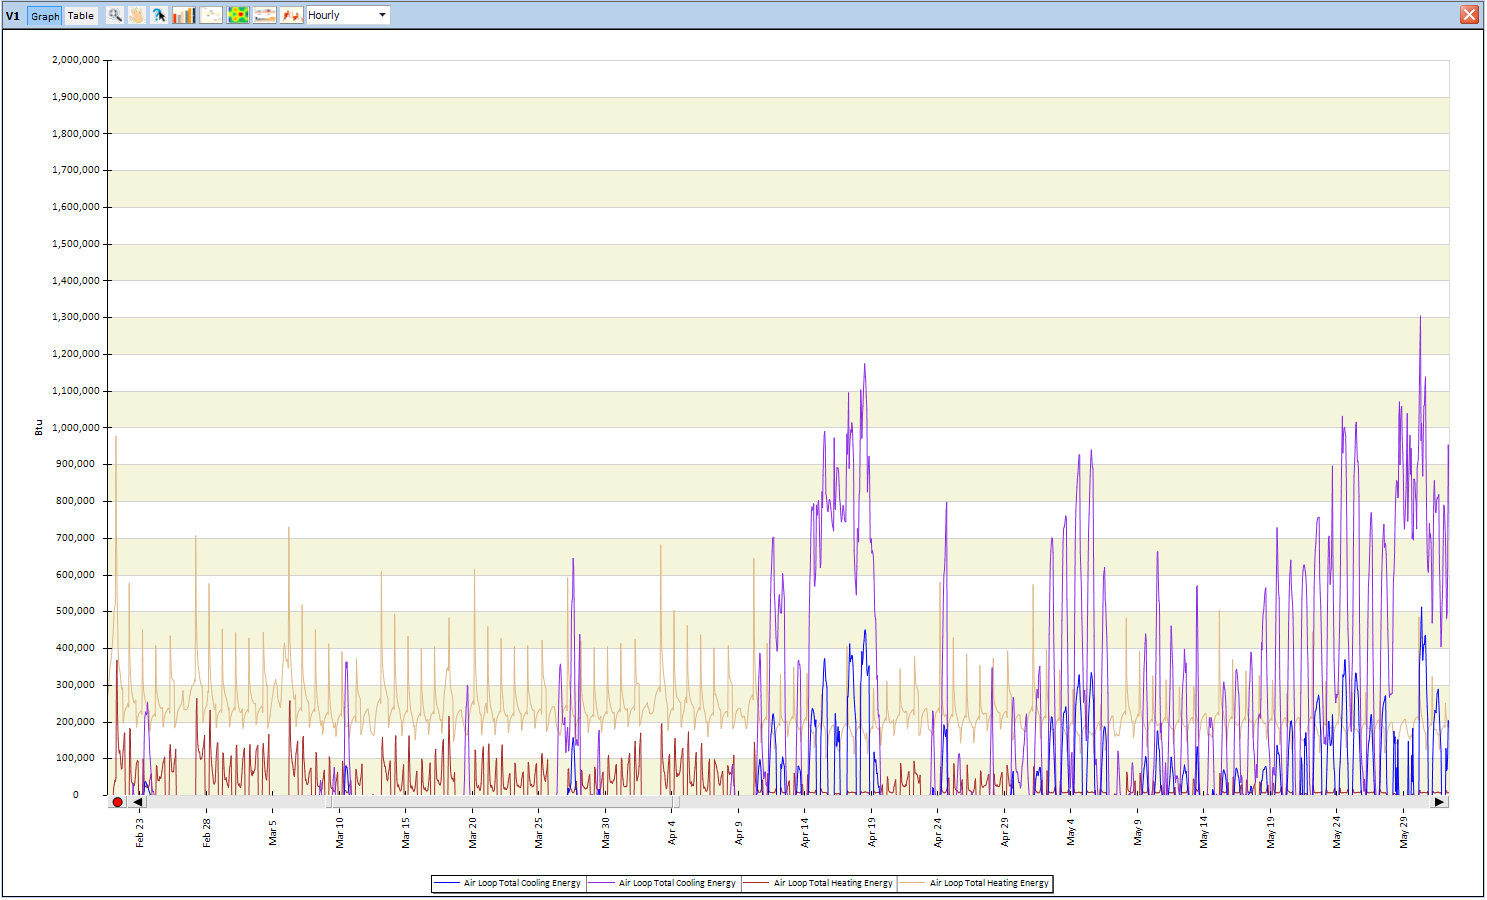
Some additional features appear on the graph for this data zoom view:
Example: rather than looking at Feb. to May, by selecting the "range bar" and sliding it to the right the user could move the time range to focus on mid August to mid November.
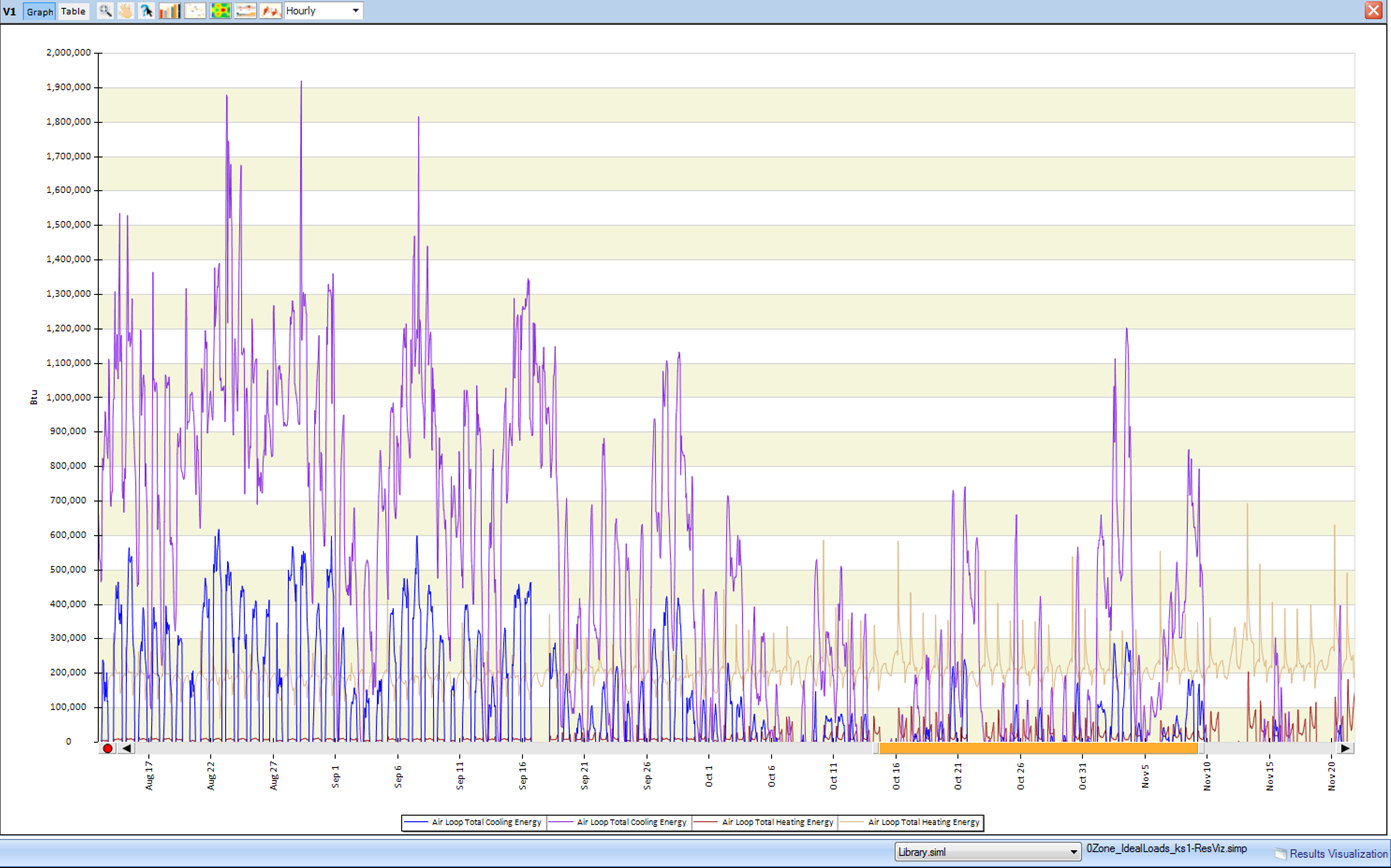
Example: If the user wanted to shorten the range displayed from mid November to the end of September, they just need to highlight the "Right Range Boundary Button" (to the right of the longer bar) and then drag it to the left until they reach the desired end day for the time range they are interested in..
The user can continue to use any combination of the zoom features to continue zooming in on a particular range of time. However if the user has the desire to get back to the original default view for the graph, they can select the data zoom icon again, which will take them back to the default view.
Always you to freely move about the cabin, we mean graph. Similar to typical pan features.
Once selected when you slide over the graph you can view the actual values of different points on the graph.
Including Environment Output Variable

Including Environment Output Variable
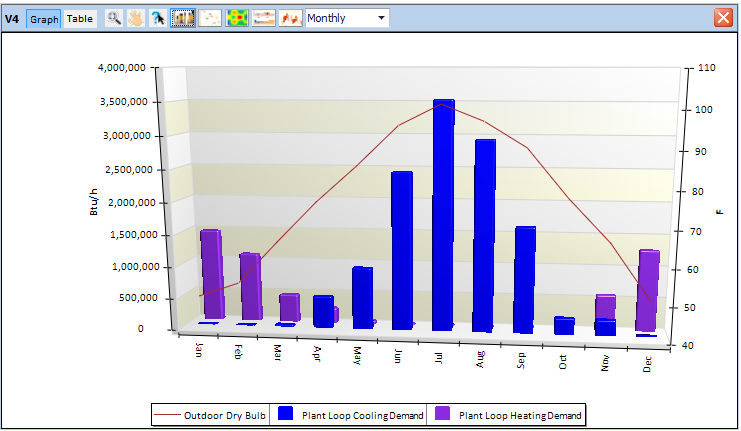

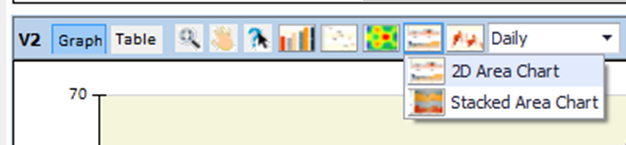
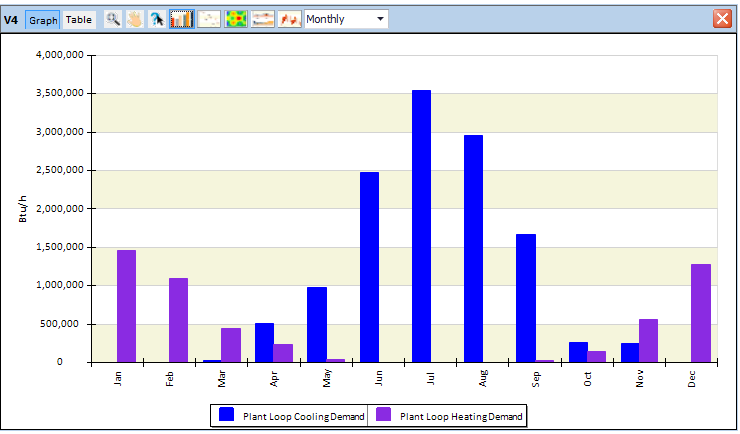
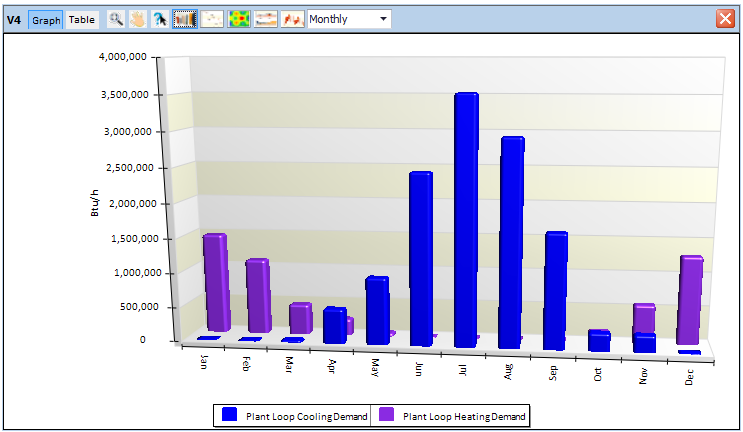
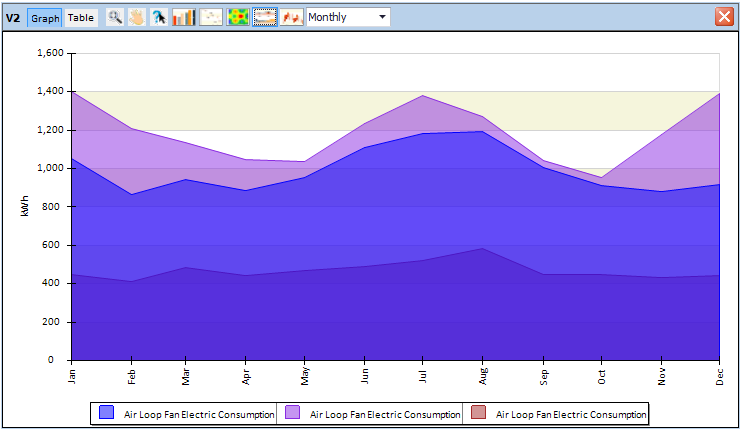
Monthly 2D Area Chart
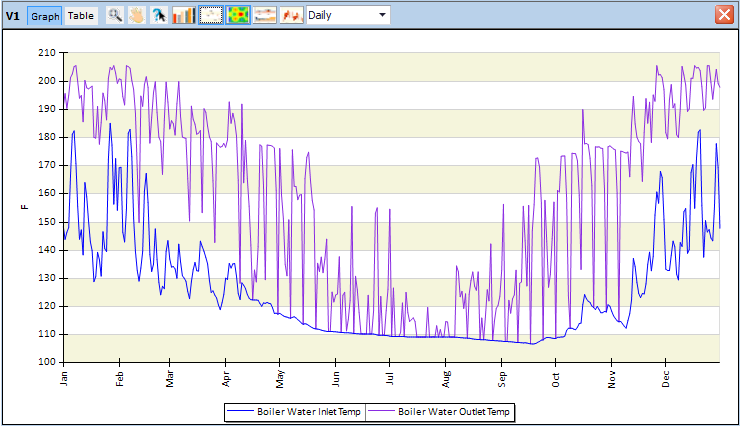
Daily 2D Area Chart

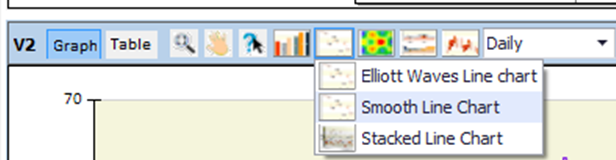
You can change the frequency displayed in the graph by selecting on the drop down arrow and selecting from the following options:
Timestep
Hourly
Daily
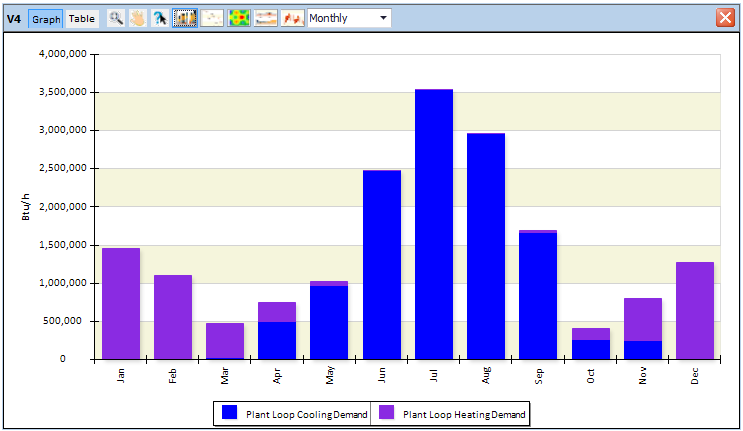
Monthly
Run Period
Note: The default frequency displayed in the Result View is determined by the frequency associated with the Output Variable that was added to the Result View.
Available frequencies are influenced by the frequency selected within the Output Request for the Output Variable that is included in the Output Request Set Template that has been selected in the Simulation Configuration.
Allows you to save a copy of the active Results View. The file format options are:
Makes a copy of the active Results View (clipboard) that can then be pasted into another document
Launches a print dialog box allowing you to print a copy of the active Results View
______________________________________________________________________________________
© Copyright 2013 Simergy, Sustainable IQ, Inc.