Workspace: Results Visualization
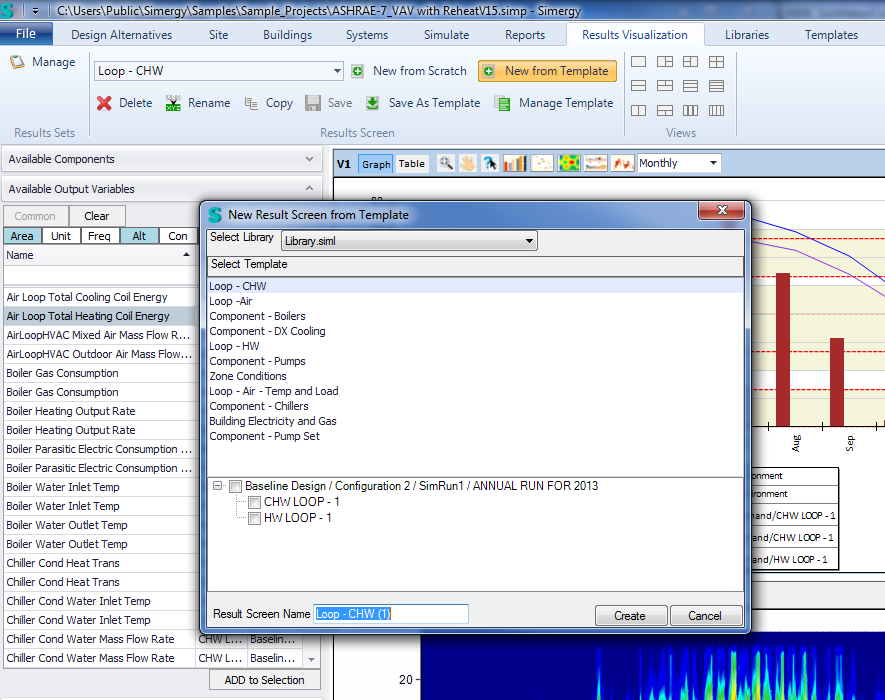
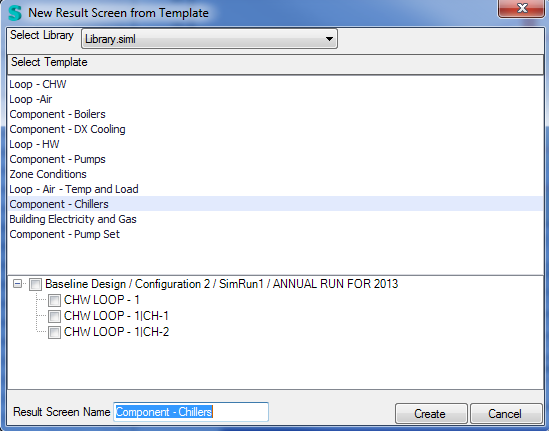
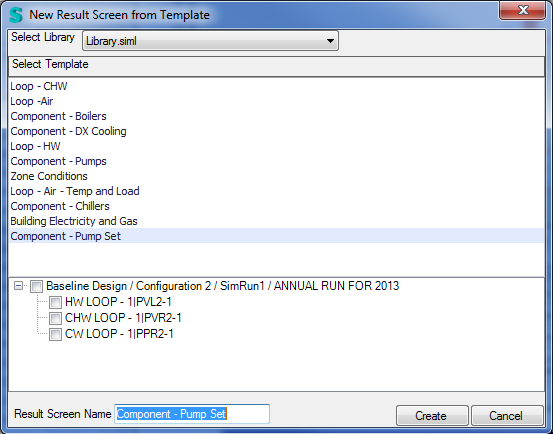
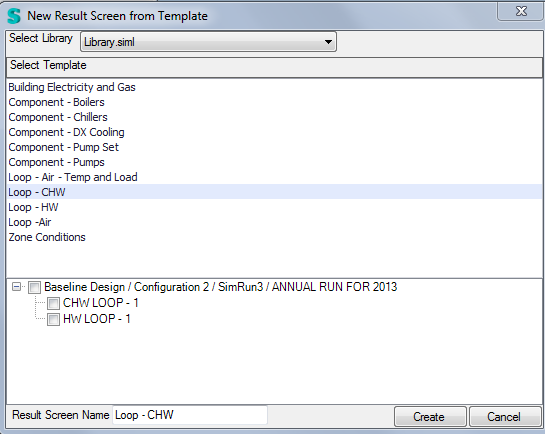
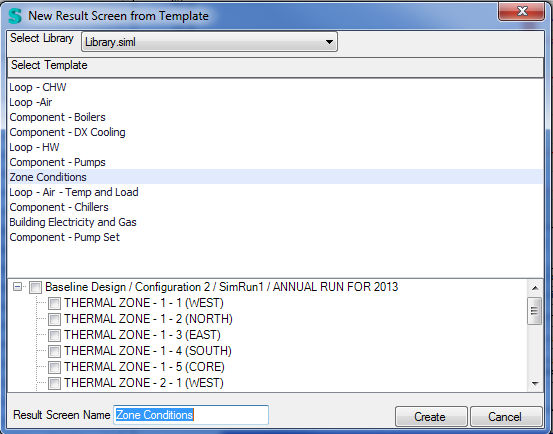
The process for utilizing the available Result Screen Templates is fairly simple (see image below):
Note: The image shows the list of Result Screen Templates that are included with the Simergy version 1 installation
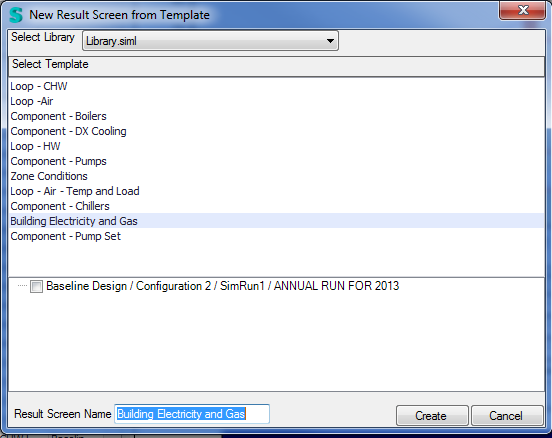
Simergy Version 1 contains the following Result Screen Templates
| Result Screen Template Names | Descriptions |
| Building Electricity and Gas | A set of four (4) Results Views that displays yearly Electricity for the facility on the left side in two formats. The first is a monthly 2d bar chart, and the second is a surface chart. On the right side the two Results Views show the two same type of views, but for the Gas for the facility. |
| Component-Boilers | A set of two (2) Results Views that on the top view displays the monthly gas consumption for the selected boilers side by side in a monthly bar chart with the Outdoor Dry Bulb temperature graphed as well to so the potential relationship. The bottom Results View also has the Outdoor Dry Bulb Temperature graphed, but the other variables on the line chart are Boiler Water Inlet and Outlet Temperature. |
| Component-Chillers | A set of four (4) Results Views that allows the comparison of four different sets of output variables for the selected chillers. The output variables include Plant Loop Cooling Demand, Chiller Evap Water Inlet and Outlet Temperatures, Chiller Evap Heat Transfer, and Chiller Evap Water and Cond Water Mass Flow Rate. |
| Component-DX Cooling | example coming soon... |
| Component-Pump Set | A set of four (4) Results Views that enables a comparison between Pump Bank Electric Power and Pump Bank Mass Flow Rate in sets of views side by side. The top Results view is an hourly view for a period in May, allowing a closer look at a strategic time of the year, while the lower Results Views allow the overall year view. |
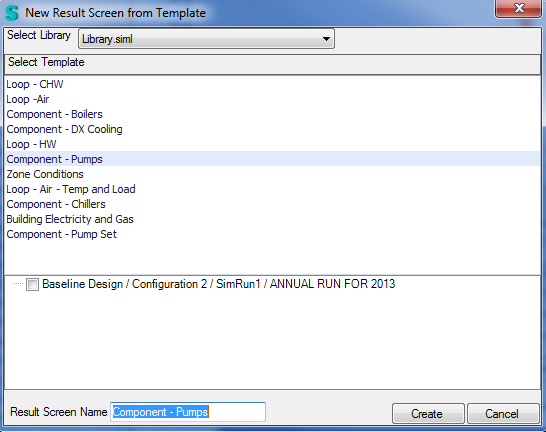
| Component-Pumps | example coming soon... |
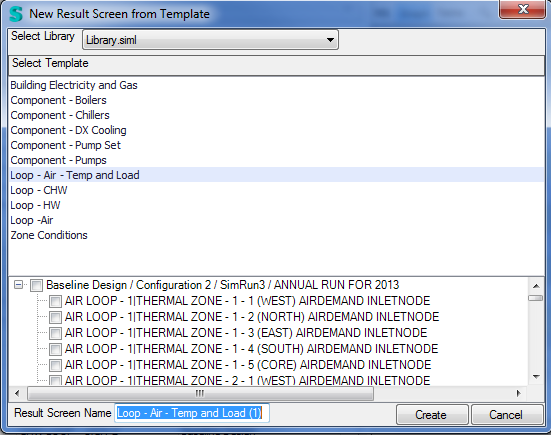
| Loop Air Temperature and Load | example coming soon... |
| Loop-CHW | A set of four (4) Results Views that has three Results Views looking at the Plant Loop Cooling Demand graphed in three different ways to enable different performance vantage points and a Results View comparing Plant Loop Inlet and Outlet Node Temperature to each other as well as the flow rate for a portion of July. |
| Loop-HW | A set of four (4) Results Views that has three Results Views looking at the Plant Loop Heating Demand graphed in three different ways to enable different performance vantage points and a Results View comparing Plant Loop Inlet and Outlet Node Temperature to each other as well as the flow rate for a portion of January. |
| Loop-Air | A set of three (3) Results Views that provides three different performance perspectives for the Air Loops selected. The first is a comparison of the total heating and cooling coil energy for the Air Loop. The second is a comparison of the Mixed Air and Outdoor Air Mass Flow Rate, and the third is a surface chart of the total cooling coil energy to enable identification of key periods of consumption over the course of the year. |
| Zone Conditions | A set of three (3) Results Views that include the same set of variables for each (Sensible Cooling and Heating Energy for the zone and the outdoor dry bulb temperature), but vary the period of time enabling an overall view (year) and two closer looks (January and July). |
The available selections are the available Results Sets.
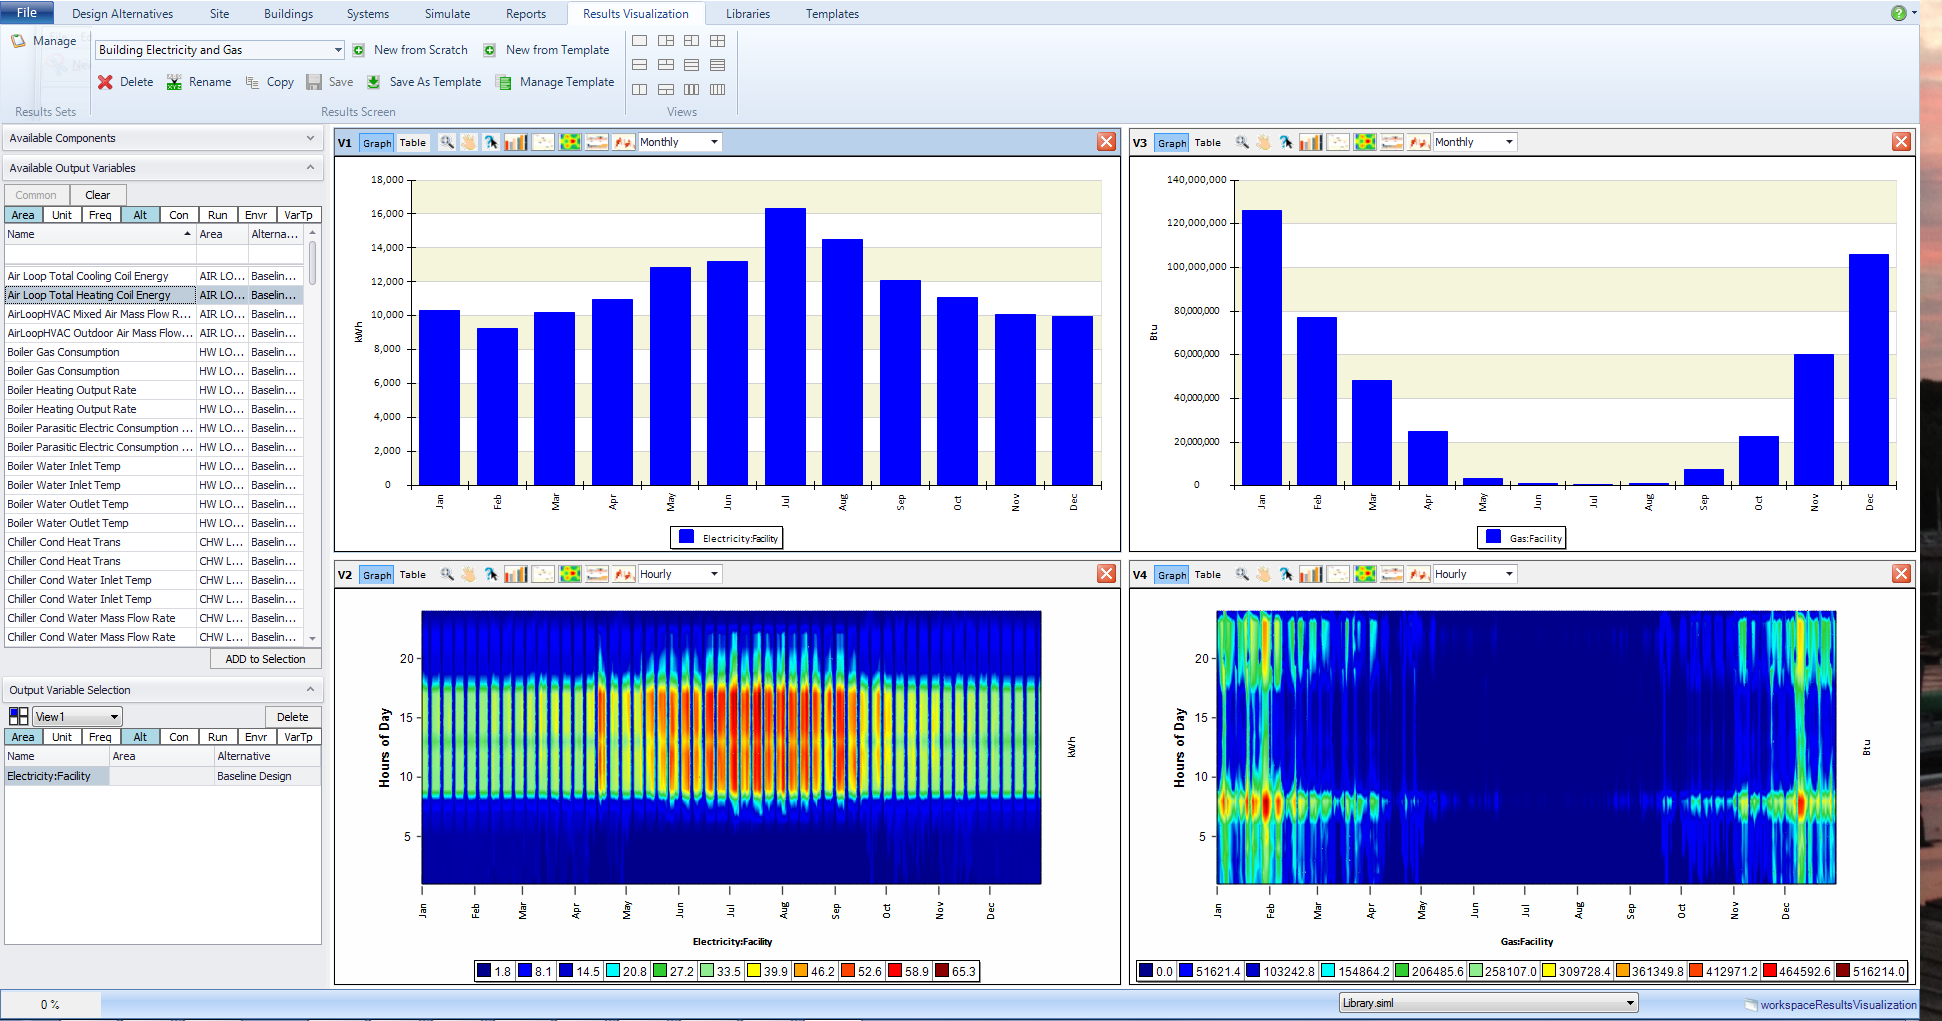
Image - Building Electricity and Gas for the sample file (ASHRAE-7_VAV with Reheat), Simulation Configuration 2.
| Results View | Chart or Graph Type | Output Variables | Area | Frequency |
| 1 | 2D Bar Chart | Electricity:Facility | Monthly | |
| 2 | Surface Chart | Electricity:Facility | Hourly | |
| 3 | 2D Bar Chart | Gas:Facility | Monthly | |
| 4 | Surface Chart | Gas:Facility | Hourly |
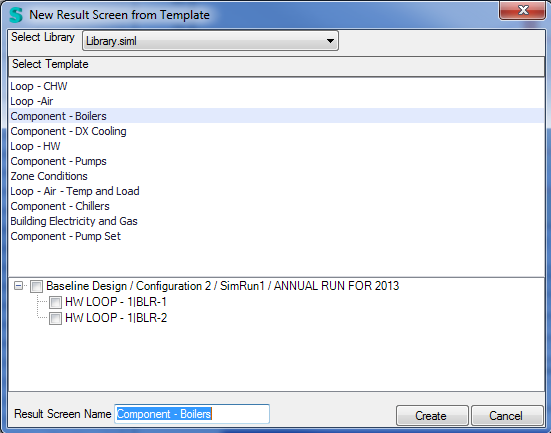
You can select any boiler or combinations of boilers within a single Result Set or multiple Results sets to create the RST.
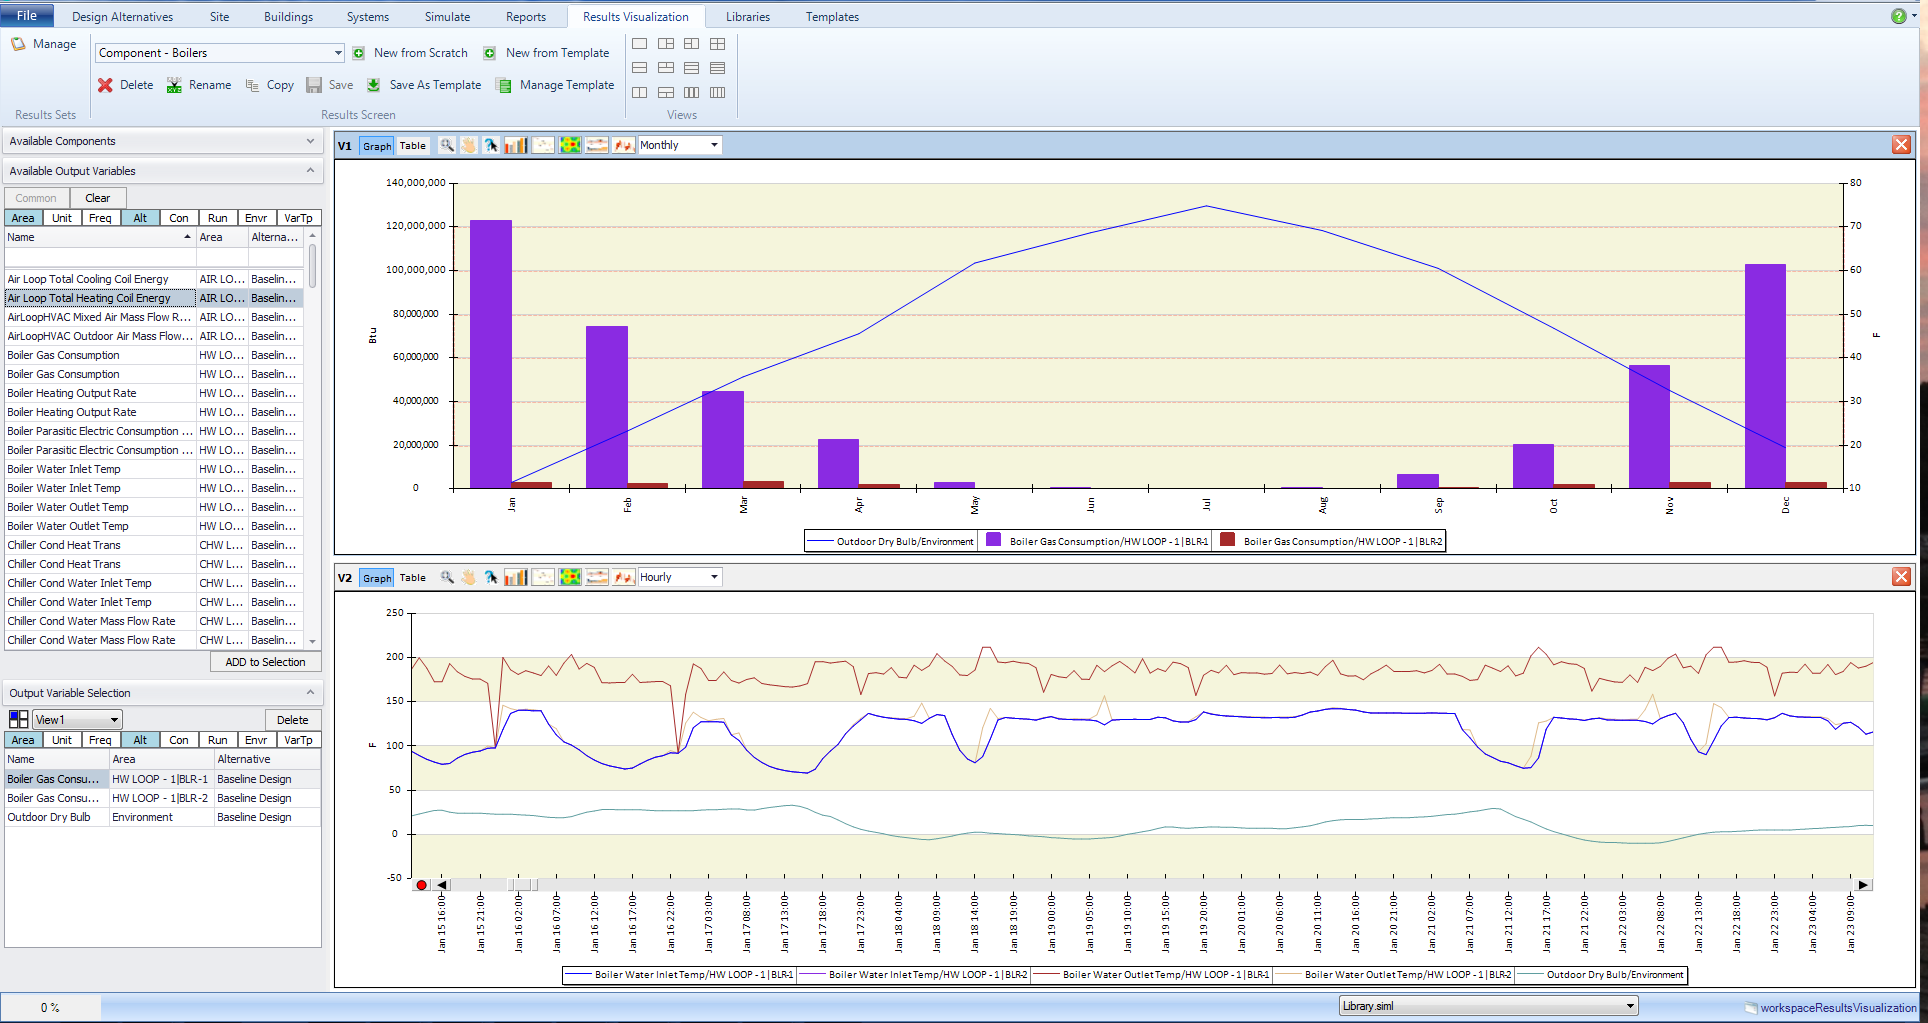
Image - Component Boilers Result Screen Template for the sample file (ASHRAE-7_VAV with Reheat), Simulation Configuration 2.
| Results View | Chart or Graph Type | Output Variables | Area | Frequency |
| 1 | 2D Bar Chart | Boiler Gas Consumption Outdoor Dry Bulb |
HW LOOP - 1|Blr Environment |
Monthly |
| 2 | Smooth Line Chart | Boiler Water Inlet Temp Boiler Water Outlet Temp Outdoor Dry Bulb |
HW LOOP - 1|Blr HW LOOP - 1|Blr Environment |
Hourly |
You can select the chilled water loops or any or all of the chillers within a single result set or across multiple Results sets.
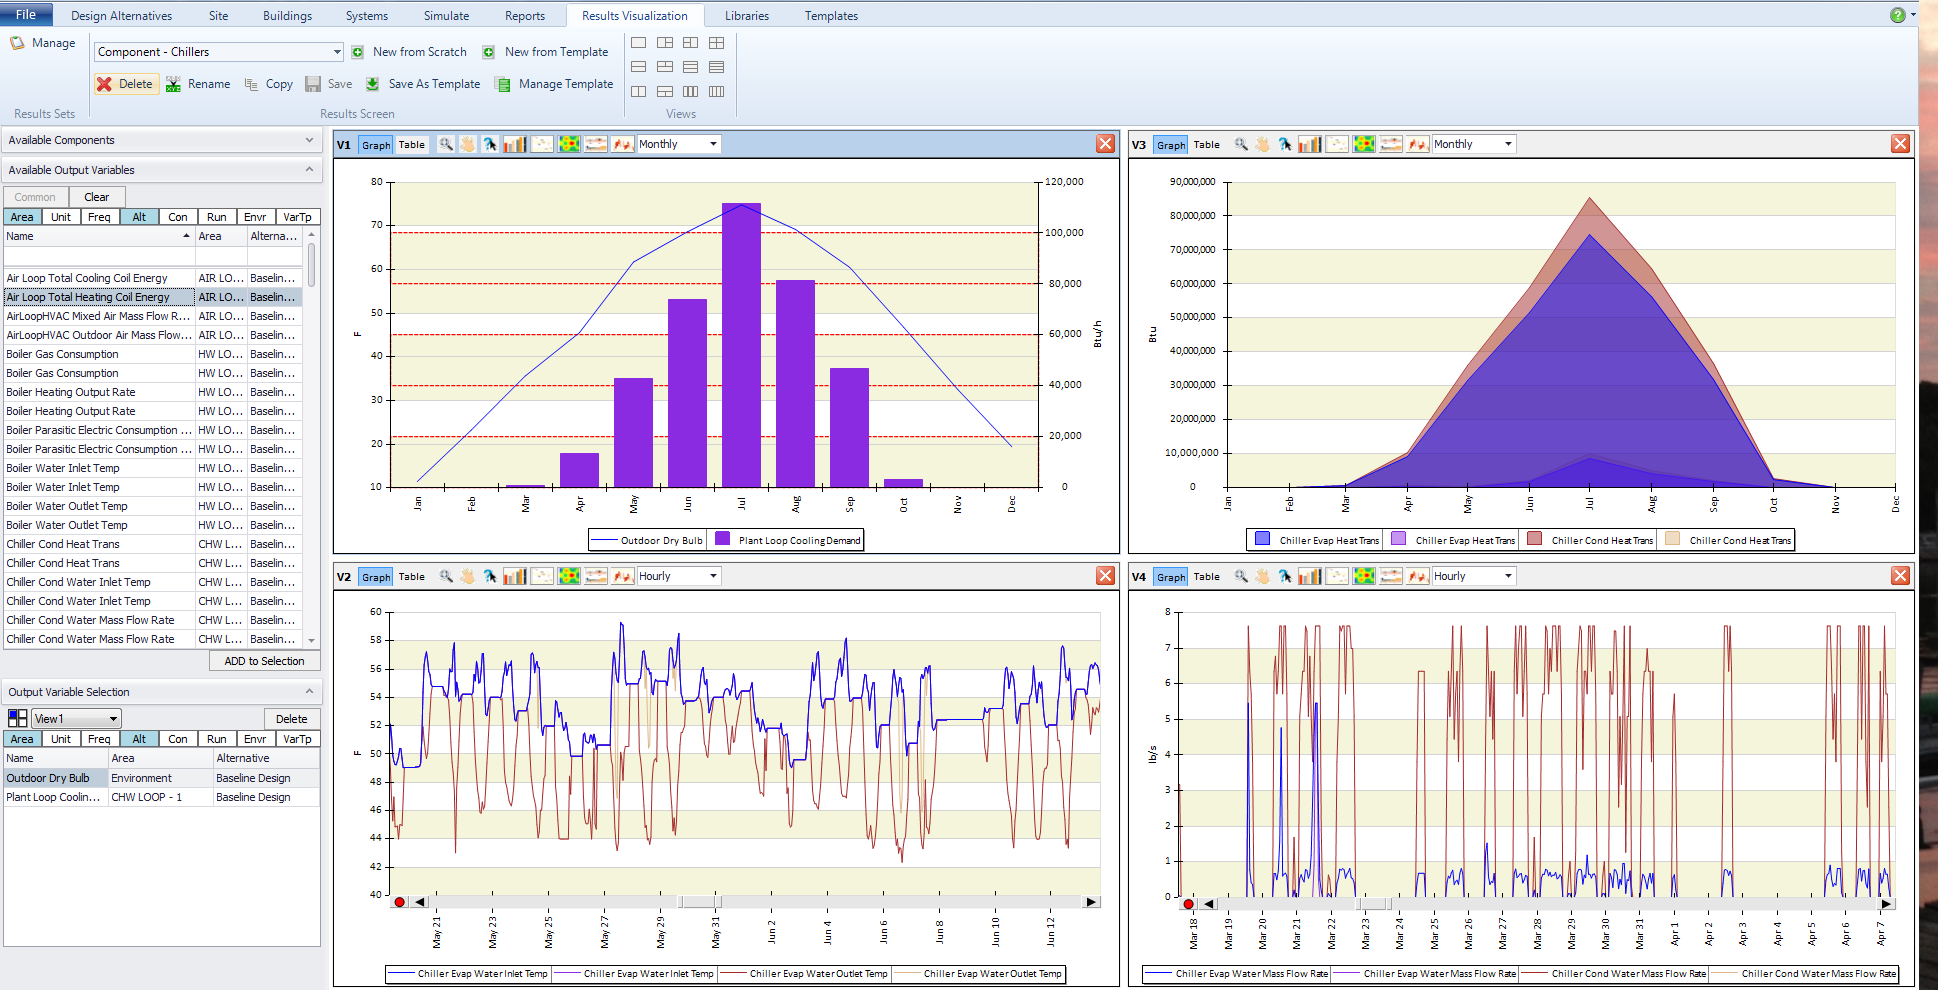
Image - Component Chillers Result Screen Template for the sample file (ASHRAE-7_VAV with Reheat), Simulation Configuration 2.
| Results View | Chart or Graph Type | Output Variables | Area | Frequency |
| 1 | 2D Bar Chart |
Outdoor Dry Bulb Plant Loop Cooling Demand |
Environment CHW LOOP-1 |
Monthly |
| 2 | Smooth Line Chart | Chiller Evap Water Inlet Temp Chiller Evap Water Outlet Temp |
CHW LOOP-1|CH-1 CHW LOOP-1|CH-1 |
Hourly |
| 3 | 2D Area Chart | Chiller Evap Heat Trans Chiller Evap Heat Trans |
CHW LOOP-1|CH-1 CHW LOOP-1|CH-1 |
Monthly |
| 4 | Smooth Line Chart | Chiller Evap Water Mass Flow Rate Chiller Cond Water Mass Flow Rate |
CHW LOOP-1|CH-1 CHW LOOP-1|CH-1 |
Hourly |
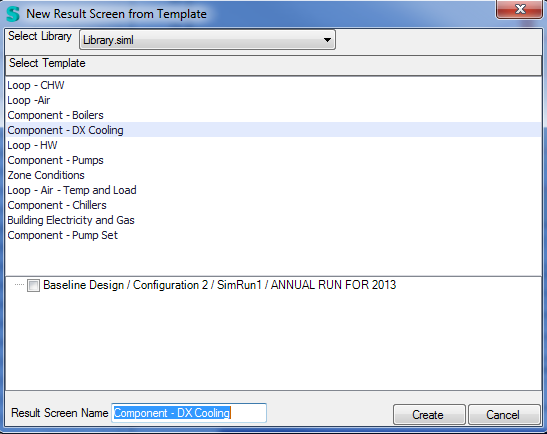
example coming soon...
| Results View | Chart or Graph Type | Output Variables | Area | Frequency |
You can select any or all of the Water Loops associated with a Results Set or multiple Results Sets.
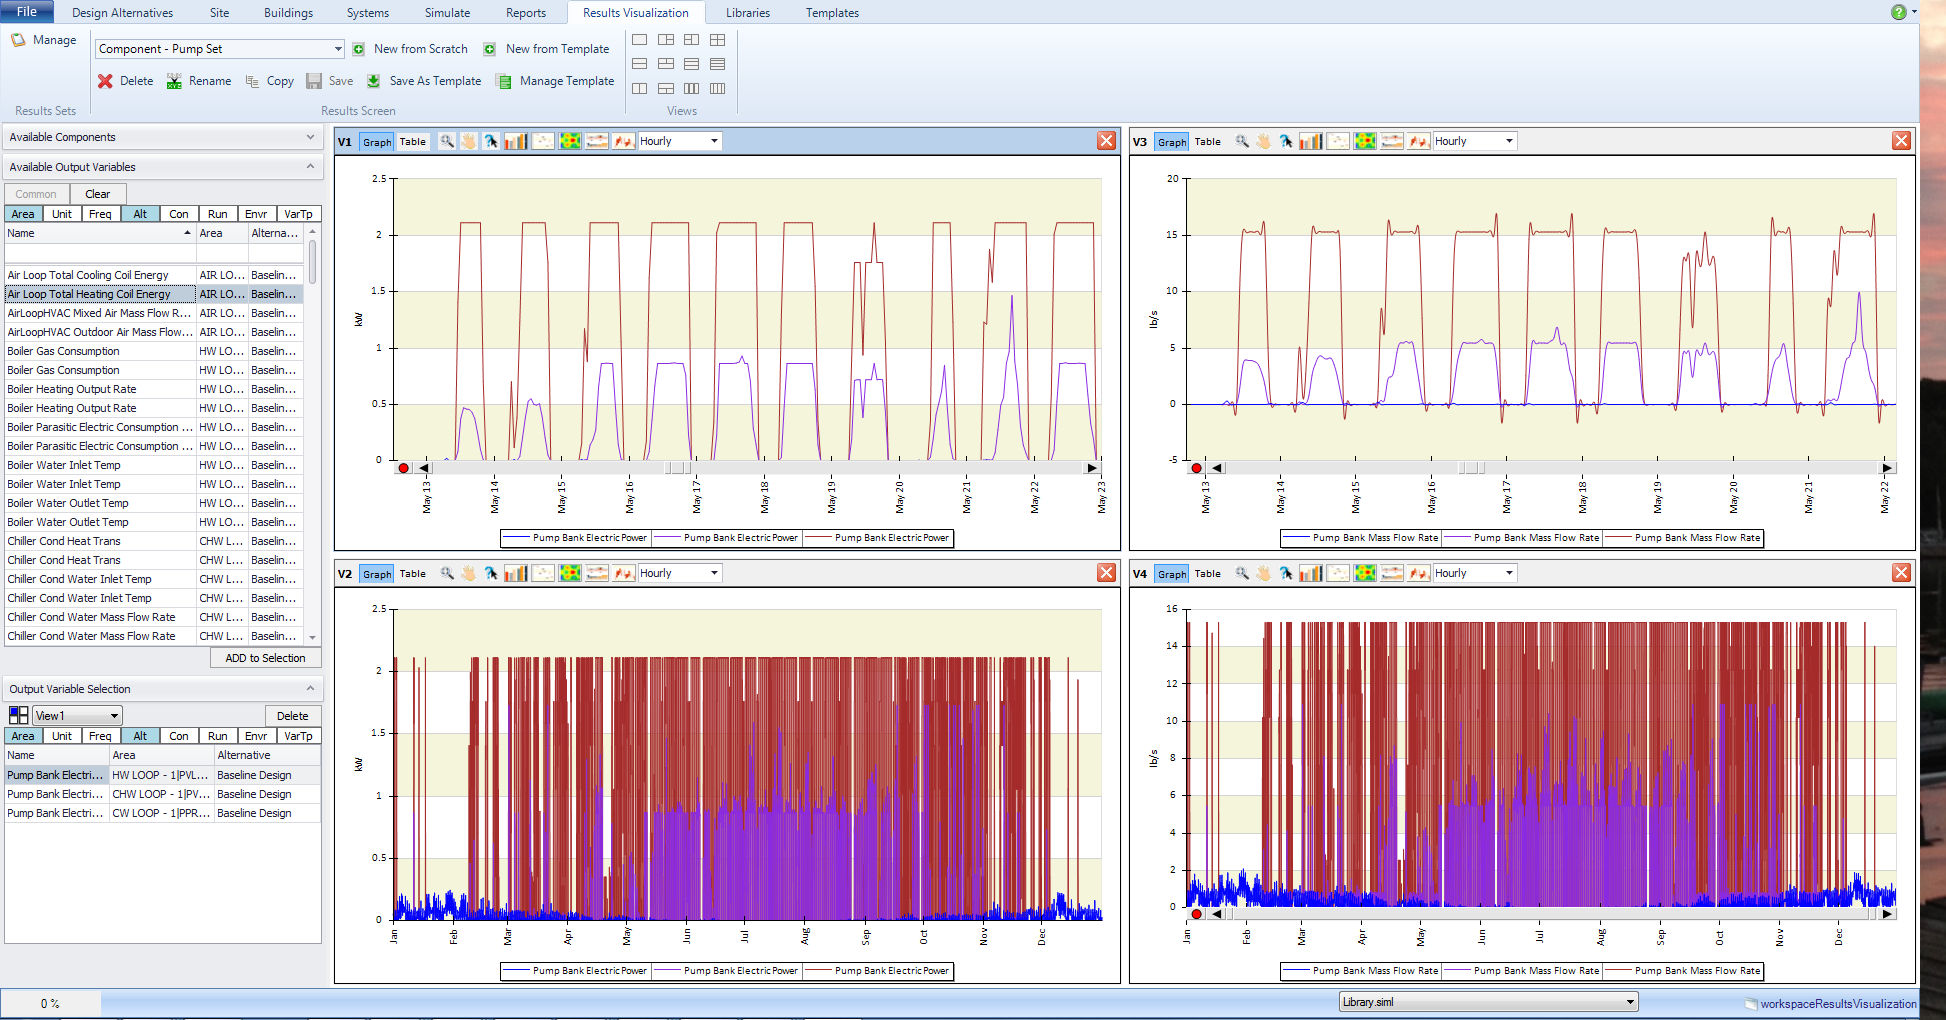
Image - Components Pump Set Result Screen Template for the sample file (ASHRAE-7_VAV with Reheat), Simulation Configuration 2.
| Results View | Chart or Graph Type | Output Variables | Area | Frequency |
| 1 | Smooth Line Chart |
Pump Bank Electric Power |
Water Loop | Hourly |
| 2 | Smooth Line Chart |
Pump Bank Electric Power |
Water Loop | Hourly |
| 3 | Smooth Line Chart |
Pump Bank Mass Flow Rate |
Water Loop | Hourly |
| 4 | Smooth Line Chart |
Pump Bank Mass Flow Rate |
Water Loop | Hourly |
example coming soon...
| Results View | Chart or Graph Type | Output Variables | Area | Frequency |
example coming soon...
| Results View | Chart or Graph Type | Output Variables | Area | Frequency |
You can select Chilled Water Loops or Hot Water Loops or both for the available Results Sets.
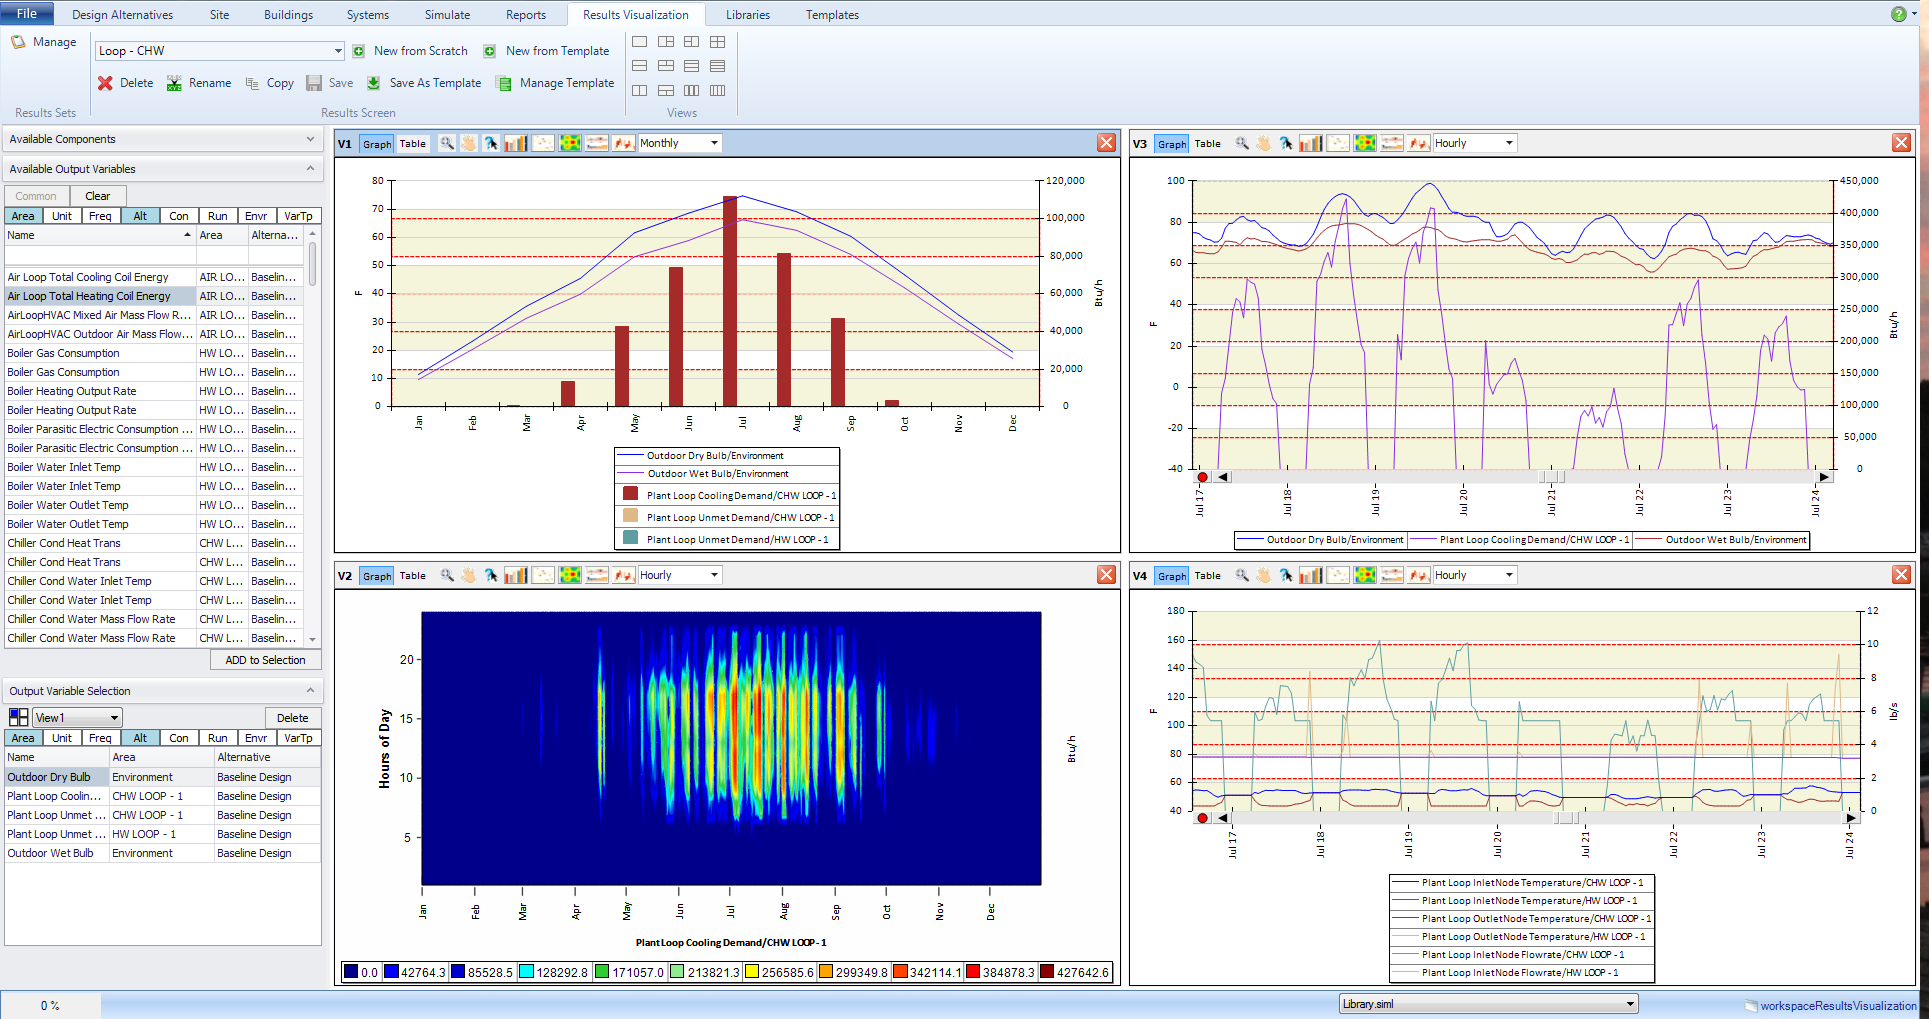
Image - Loop-CHW for the sample file (ASHRAE-7_VAV with Reheat), Simulation Configuration 2.
| Results View | Chart or Graph Type | Output Variables | Area | Frequency |
| 1 | Column Chart | Outdoor Dry Bulb Plant Loop Cooling Demand Plant Loop Unmet Demand Plant Loop Unmet Demand Outdoor Wet Bulb |
Environment CHW Loop - 1 CHW Loop - 1 HW Loop - 1 Environment |
Monthly |
| 2 | Line Graph | Plant Loop Cooling Demand | CHW Loop - 1 | Hourly |
| 3 | Contour Plot | Outdoor Dry Bulb Plant Loop Cooling Demand Outdoor Wet Bulb |
Environment CHW Loop - 1 Environment |
Hourly |
| 4 | Line Graph | Plant Loop InletNode Temperature Plant Loop InletNode Temperature Plant Loop OutletNode Temperature Plant Loop OutletNode Temperature Plant Loop InletNode Flowrate Plant Loop InletNode Flowrate |
CHW Loop - 1 HW Loop - 1 CHW Loop - 1 HW Loop - 1 CHW Loop - 1 HW Loop - 1 |
Hourly |

You can select any or all of the Hot Water and Chilled Water loops for a single Result Set or Multiple Results Sets
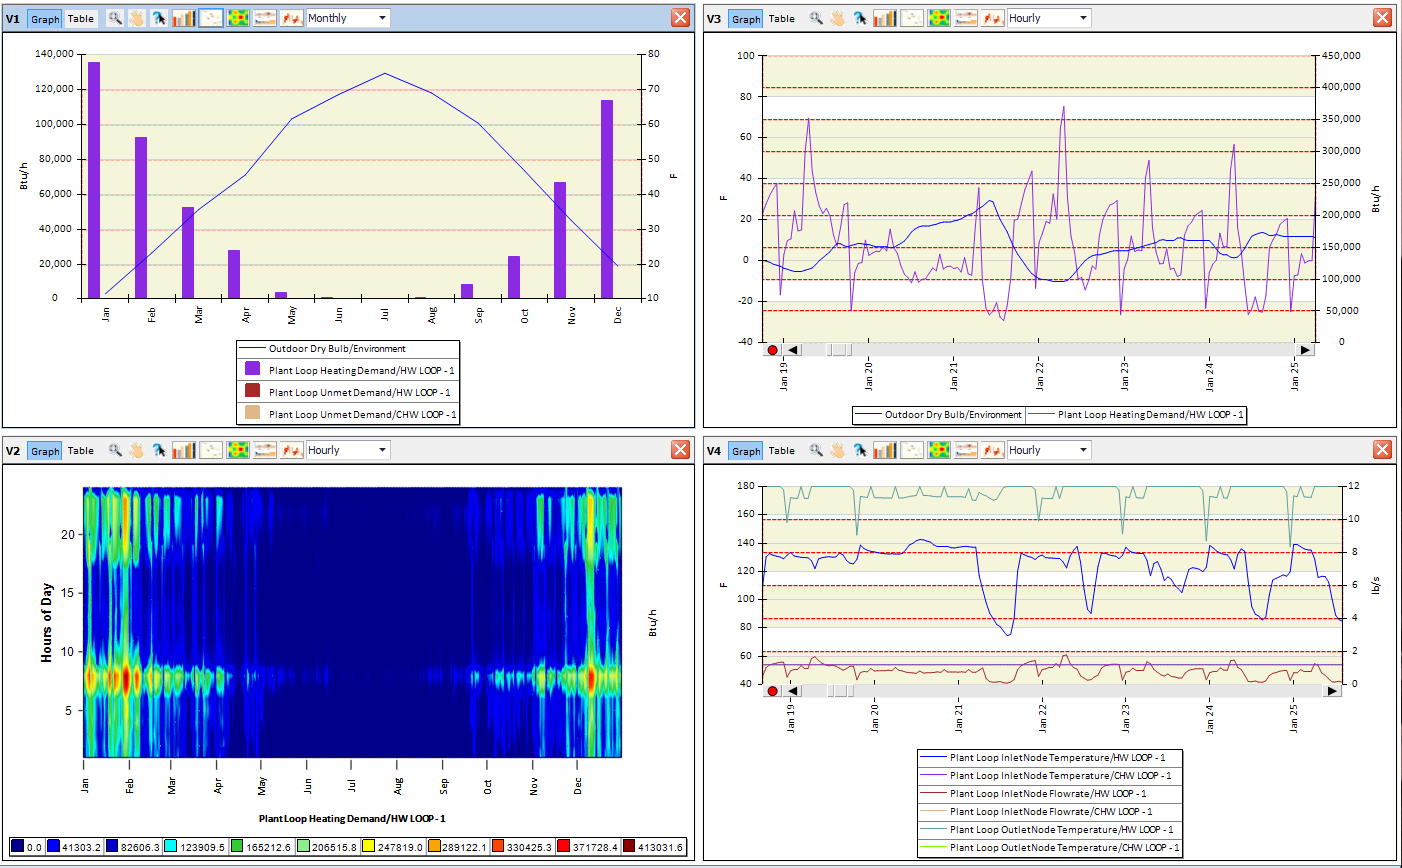
Image - Loop-HW for the sample file (ASHRAE-7_VAV with Reheat), Simulation Configuration 2.
| Results View | Chart or Graph Type | Output Variables | Area | Frequency |
| 1 | 2D Bar Chart |
Plant Loop Heating Demand Outdoor Dry Bulb Plant Loop Unmet Demand Plant Loop Unmet Demand |
HW LOOP-1 Environment HW LOOP-1 CHW LOOP-1 |
Monthly |
| 2 | Surface Chart | Plant Loop Heating Demand | HW LOOP-1 | Hourly |
| 3 | Smooth Line Chart |
Outdoor Dry Bulb Plant Loop Heating Demand |
Environment HW LOOP-1 |
Hourly |
| 4 | Smooth Line Chart | Plant Loop InletNode Temperature Plant Loop InletNode Temperature Plant Loop OutletNode Temperature Plant Loop OutletNode Temperature Plant Loop InletNode Flowrate Plant Loop InletNode Flowrate |
CHW Loop - 1 HW Loop - 1 CHW Loop - 1 HW Loop - 1 CHW Loop - 1 HW Loop - 1 |
Hourly |
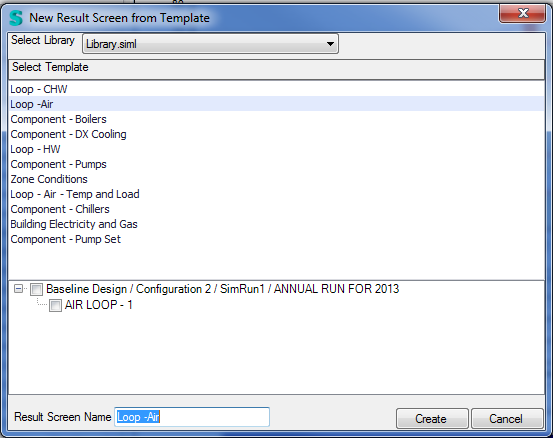
You can select any of the Air Loops for a single Result Set or multiple Results Sets
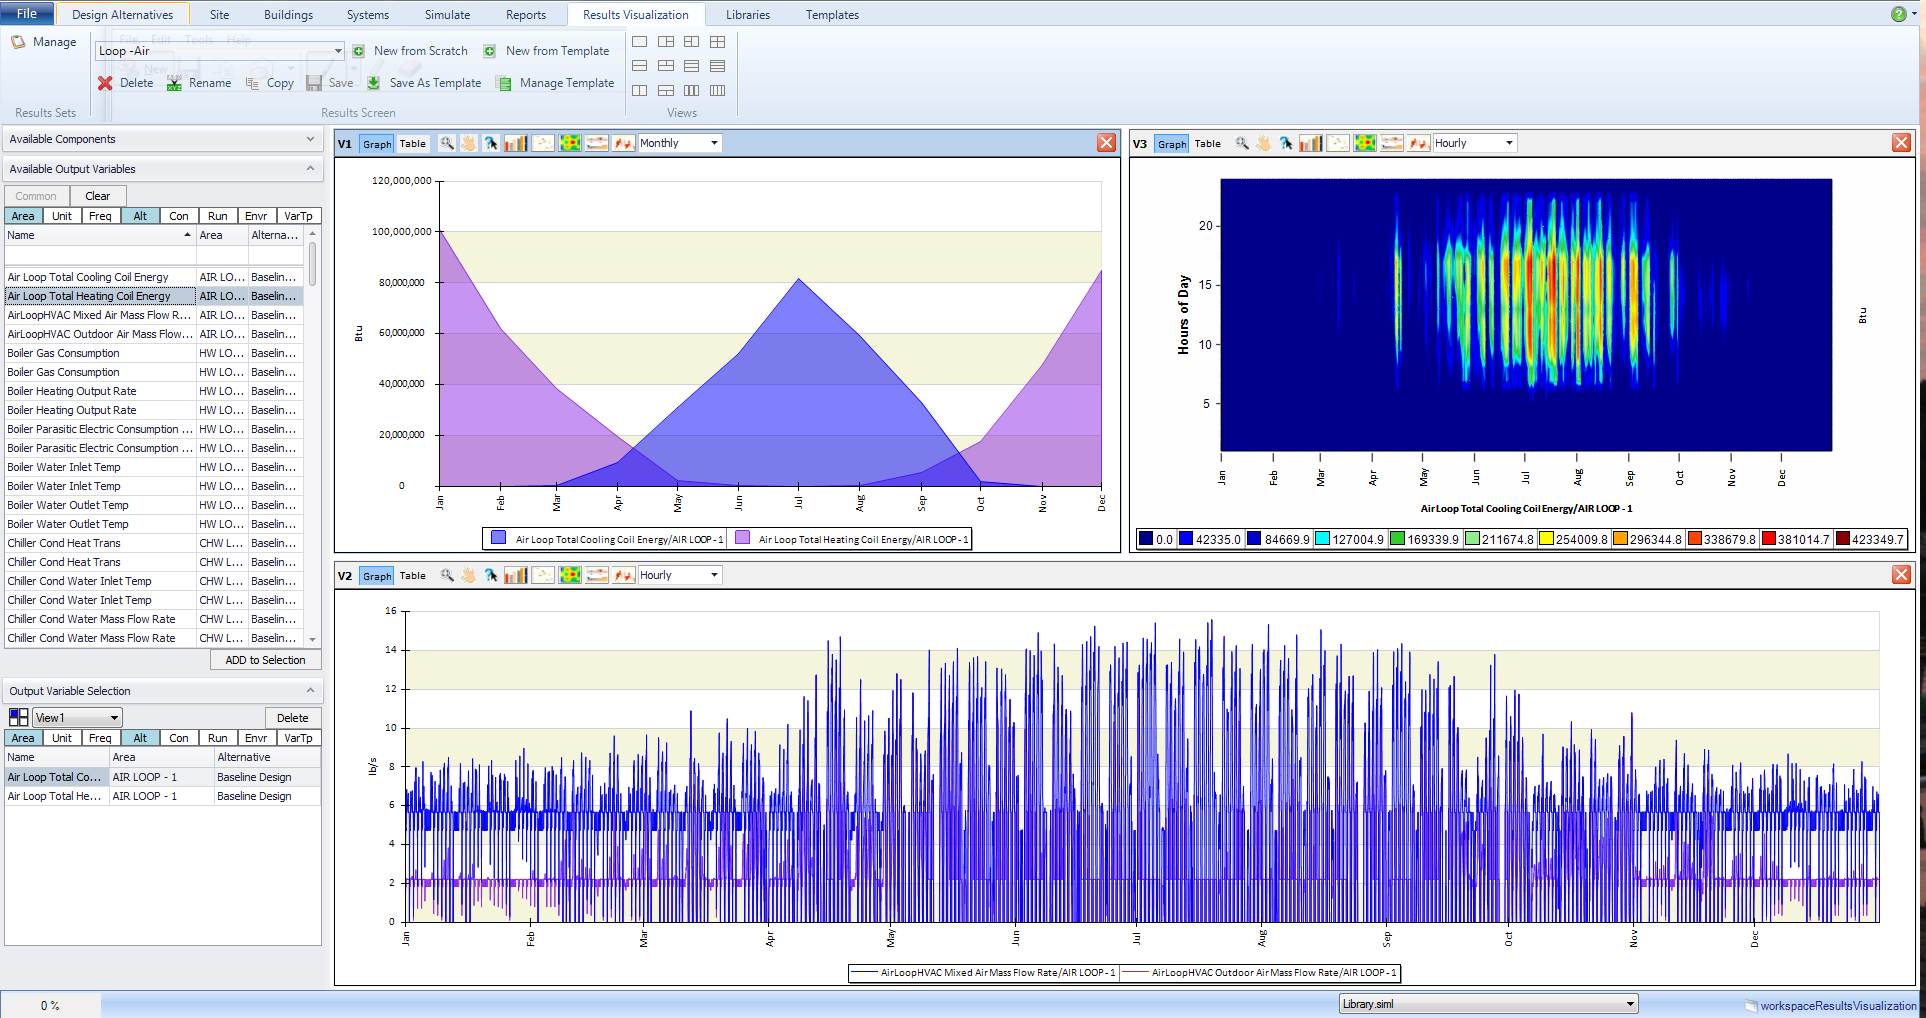
Image - Loop-Air for the sample file (ASHRAE-7_VAV with Reheat), Simulation Configuration 2.
| Results View | Chart or Graph Type | Output Variables | Area | Frequency |
| 1 | 2D Area Chart |
Air Loop Total Cooling Energy Air Loop Total Heating Energy |
Air LOOP - 1 Air LOOP - 1 |
Monthly |
| 2 | Smooth Line Chart | Air Loop HVAC Mixed Air Mass Flow Rate Air Loop HVAC Outdoor Air Mass Flow Rate |
Air LOOP - 1 Air LOOP - 1 |
Hourly |
| 3 | Surface Chart | Air Loop Total Cooling Coil Energy | Air LOOP - 1 | Hourly |
You can select any of the thermal zones associated with a single Result Set or multiple Results Sets.
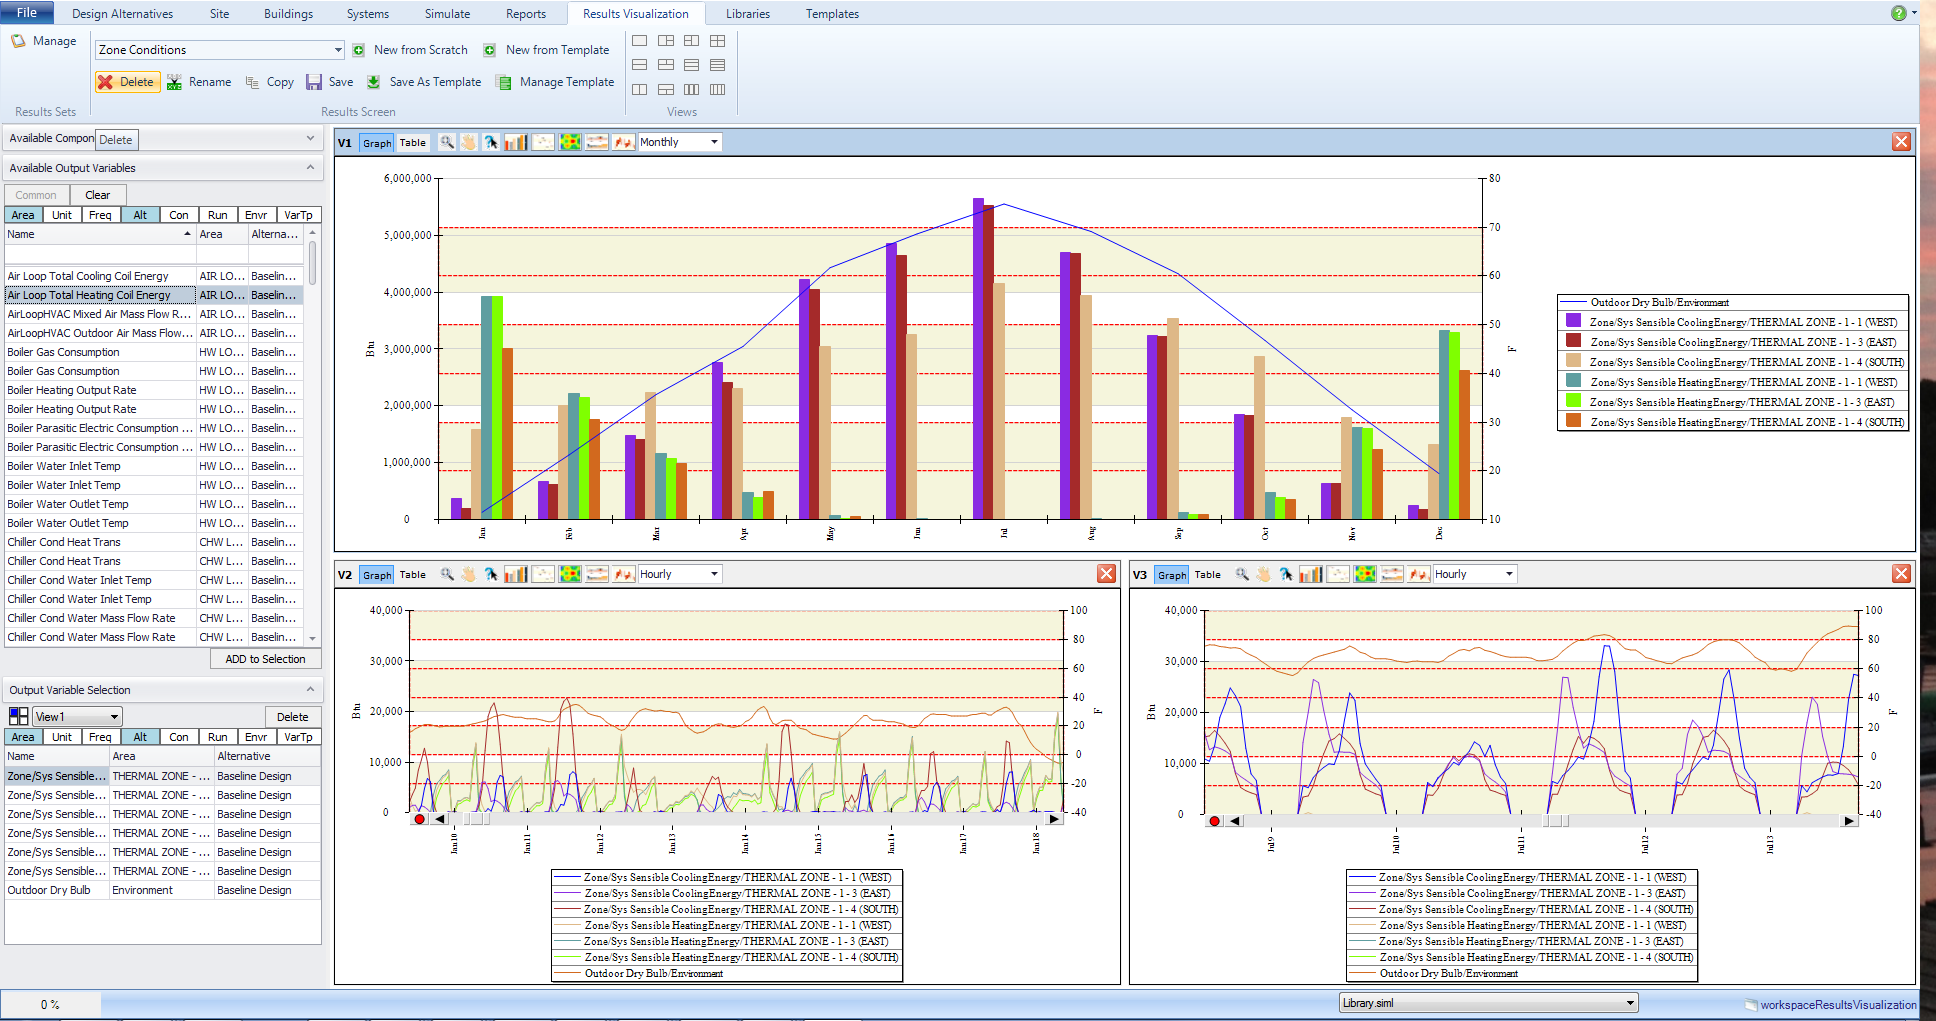
Image - Zone Conditions Results Screen Template for the sample file (ASHRAE-7_VAV with Reheat), Simulation Configuration 2.
| Results View | Chart or Graph Type | Output Variables | Area | Frequency |
| 1 | 2D Bar Chart |
Zone/Sys Sensible Cooling Energy Zone/Sys Sensible Heating Energy Outdoor Dry Bulb |
Thermal Zone Thermal Zone Environment |
Monthly |
| 2 | Smooth Line Chart |
Zone/Sys Sensible Cooling Energy Zone/Sys Sensible Heating Energy Outdoor Dry Bulb |
Thermal Zone Thermal Zone Environment |
Hourly |
| 3 | Smooth Line Chart |
Zone/Sys Sensible Cooling Energy Zone/Sys Sensible Heating Energy Outdoor Dry Bulb |
Thermal Zone Thermal Zone Environment |
Hourly |
______________________________________________________________________________________
© Copyright 2013 Simergy, Sustainable IQ, Inc.