Case Study 3: Mixed-Use Building C
Description: A mixed-use building project with (2) stories of underground parking, (1) story of retail, which wraps around a (6) story office tower. Each occupancy (parking, retail, office) is modeled as a Building Section using the appropirate Loads & Conditions template for that occupancy.
HVAC Systems: Heating and cooling is provided by Variable Refrigerant Flow (VRF) systems. Air handling is de-centralized and provided by the unitary VRF terminal units in the zones
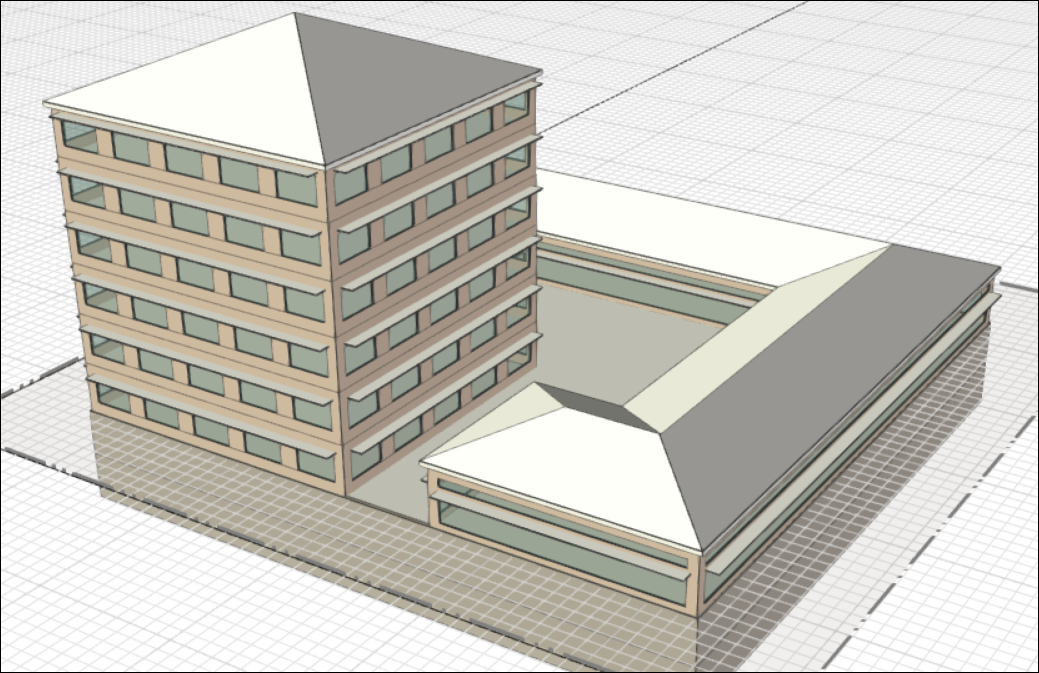
Figure 1: 3D view of the building geometry
Internal loads: The two underground stories have no internal loads or zone condition templates since this is just parking (these thermal zones are grouped into a Zone Group just for the sake of grouping). The rectangular section zones are grouped into the office group and the L-shaped retail zones are grouped into the retail group with corresponding internal loads and zone condition templates.
| Internal load type | Value | Weekday | Saturday | Sunday |
| People | 13.93 m2/person 149.94 ft2/person |
 |
 |
 |
| Lights | 10.76 W/m2 1.0 W/ft2 |
 |
 |
 |
| Electrical Equip. | 8.61 W/m2 0.8 W/ft2 |
 |
 |
 |
| Internal load type | Value | Weekday | Saturday | Sunday |
| People | ? m2/person 100 ft2/person |
 |
 |
 |
| Lights | ? W/m2 1.5 W/ft2 |
 |
 |
 |
| Electrical Equip. | ? W/m2 0.86 W/ft2 |
 |
 |
 |
| Thermostat type | Min/Avg/Max | Weekday | Saturday | Sunday |
| Heating Schedule | 15.6/18.4/21.1 C 60.0/65.8/70.0 F |
 |
 |
 |
| Cooling Schedule | 23.9/26.3/29.4 C 75.0/79.3/85.0 F |
 |
 |
 |
| Thermostat type | Min/Avg/Max | Weekday | Saturday | Sunday |
| Heating Schedule | ?? C -76/2.9/69.8 F |
 |
 |
 |
| Cooling Schedule | ?? C 75.2/220/392 F |
 |
 |
 |
HVAC: Variable Refrigerant Flow (VRF) system
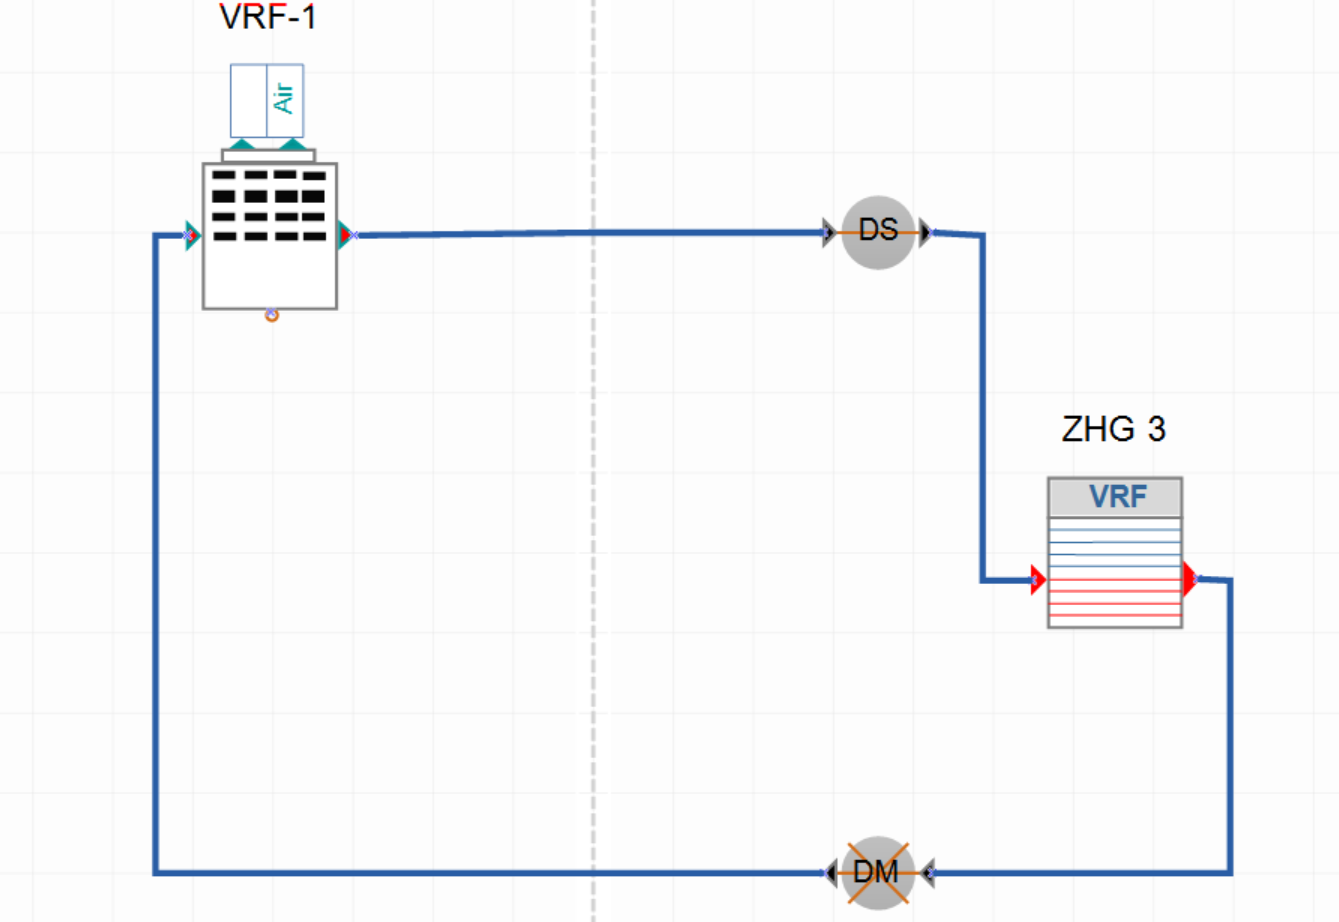
Figure 2: VRF loop diagram overview (click any image to enlarge)
Results: compared to an ASHRAE-7 system (VAV reheat air terminals with water based cooling and heating, hot water loop with 2 boilers, chilled water loop with two chillers and a condenser loop with 2 cooling towers). The comparison shows that the VRF system uses less energy in heating, but more for fans and cooling. Pumps and heat rejection are not explicitly reported for a VRF system. Overall the difference in site energy is relatively small (2,5%). .
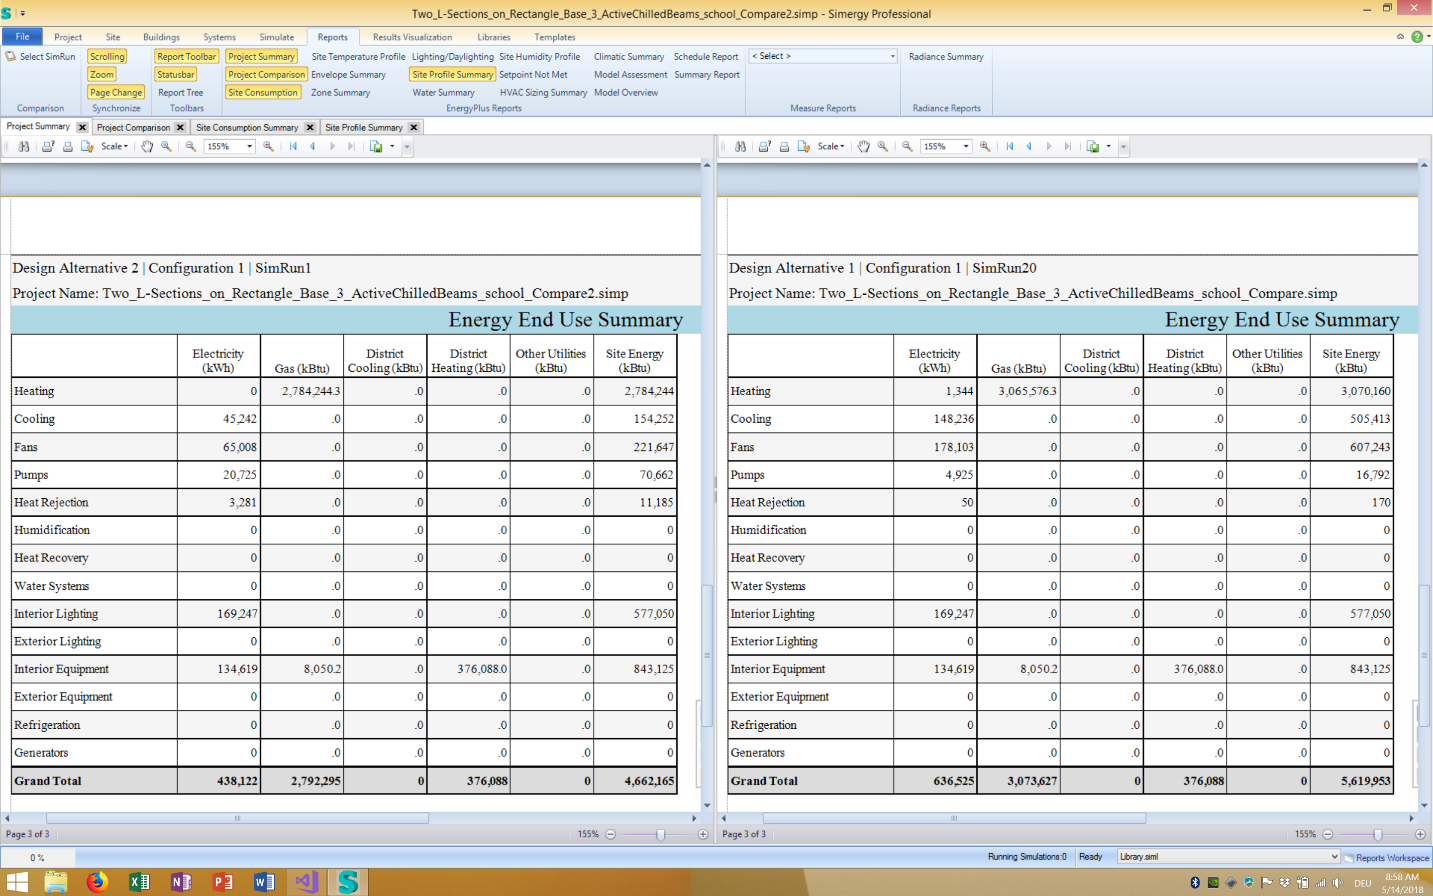
Figure 3: Comparing Page 3 of Project Summary report: “Energy End Use Summary”
The next graph compare the cooling and heating energy between the two design alternatives. The lower graphs shows the air temperature as well as heating and cooling setpoints of the same zone.
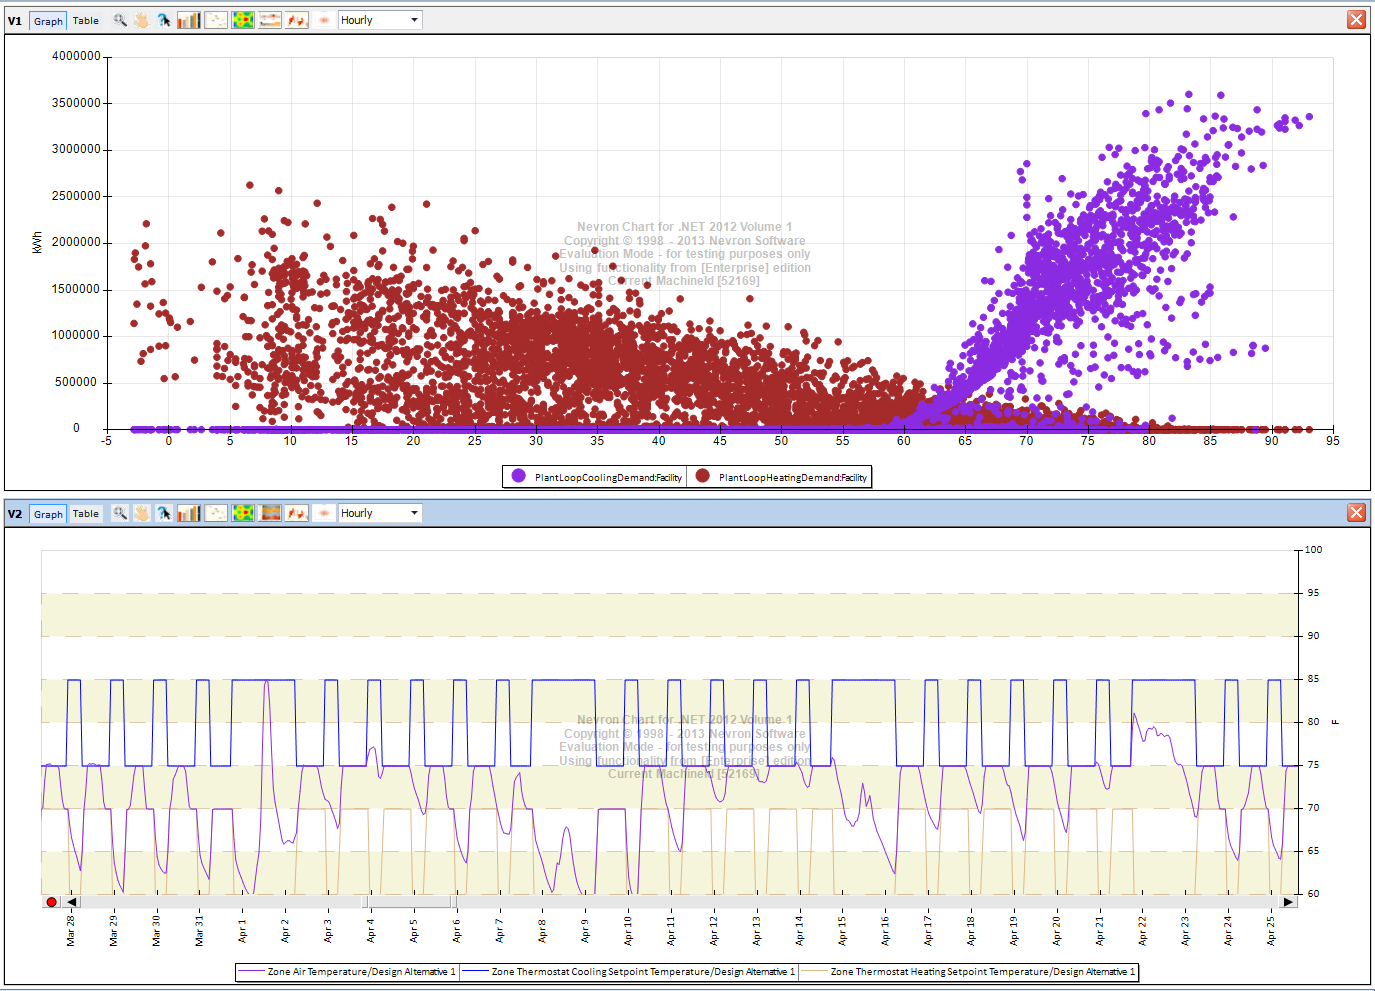
Figure 4: Cooling and heating energy demand over outside air temperature and Zone Air Temperature of a specific zone in context of the heating and cooling setpoint temperatures.
DisplayOrder: 3