How can I plot monthly consumption and demand data?
Results Visualization with monthly data
In EnergyPlus and Simergy there exists a large range of output variables and output meters. All of which can be either defined in the output requests set template or added to the InjectIDF.idf file.
Typical electricity or gas meters at the facility and building level are as follows:
|
Electricity:Facility |
Electricity:Building |
|
Electricity:HVAC |
|
|
Electricity:Plant |
To better understand which meter sums up other meters, you can refer to the “eplusout.mtd” file that contains all relevant meters for each specific run.
More specific electricity meters are:
|
Electricity:Facility |
Electricity:Building |
InteriorEquipment:Electricity |
|
InteriorLights:Electricity |
||
|
Electricity:HVAC |
Fans:Electricity |
|
|
HeatRecovery:Electricity |
||
|
Humidifier:Electricity |
||
|
Coils:Heating:Electricity |
||
|
Coils:Cooling:Electricity |
||
|
Electricity:Plant |
Pumps:Electricity |
|
|
Cooling:Electricity |
||
|
Heating:Electricity |
||
|
HeatRejection:Electricity |
||
|
Refrigeration:Electricity |
||
|
WaterSystems:Electricity |
||
|
Cogeneration:Electricity |
||
|
WaterHeater:WaterSystems:Electricity |
||
|
WaterSystems:Electricity |
||
|
ExteriorEquipment:Electricity |
|
|
|
ExteriorLighting:Electricity |
Some example for gas meters are:
|
Gas:Facility |
Gas:Building |
InteriorEquipment:Gas |
|
Gas:HVAC |
Heating:Gas |
|
|
Cooling:Gas |
||
|
Gas:Plant |
Boilers:Heating:Gas |
|
|
Cogeneration:Gas |
||
|
Refrigeration:Gas |
||
|
WaterHeater:WaterSystems:Gas |
||
|
WaterSystems:Gass |
||
|
ExteriorEquipment:Gas |
|
In order to output electric demand the following variables can be added:
|
Facility Total Electric Demand Power |
Facility Total Building Electric Demand Power |
|
Facility Total HVAC Electric Demand Power |
Similar to before the first variable is the sum of the other two (building and HVAC).
In Simergy Version 4.0, a new output request set template is available that contains all mentioned meters and variables (Electric/gas consumption and demand).
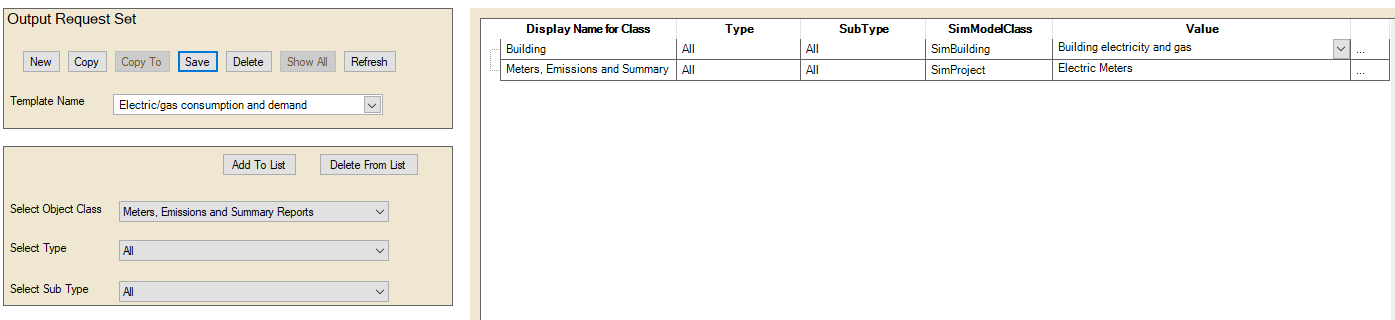
Templates workspace – Sample output request set template
This template contains one or more output request sets which are also editable, so the user can add or remove meters and output variables. We recommend leaving the Frequency of reporting at its default “hourly” value. The interval is very easily adjusted in the Results Visualization workspace.
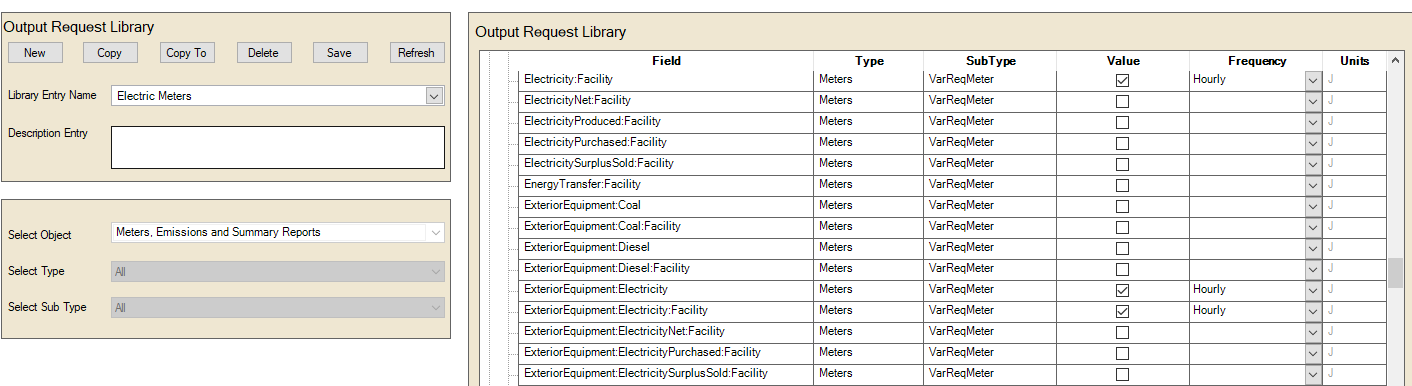
Library workspace – Sample output request set
Once you assign the output request set to a simulation configuration in the simulation workspace, the variables and meters get added to the IDF file on export. After a successful simulation run they are accessible via the Result Visualization workspace. Below are two bar chart examples showing total electrical demand and total electricity on a monthly interval as well as electrical and gas consumption.
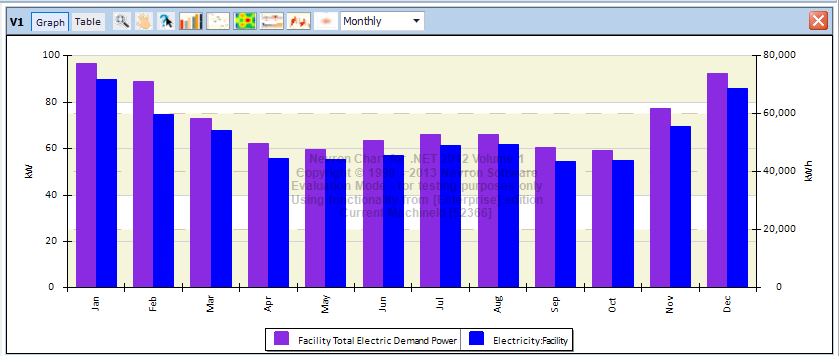
Results Visualization – Electrical demand and consumption
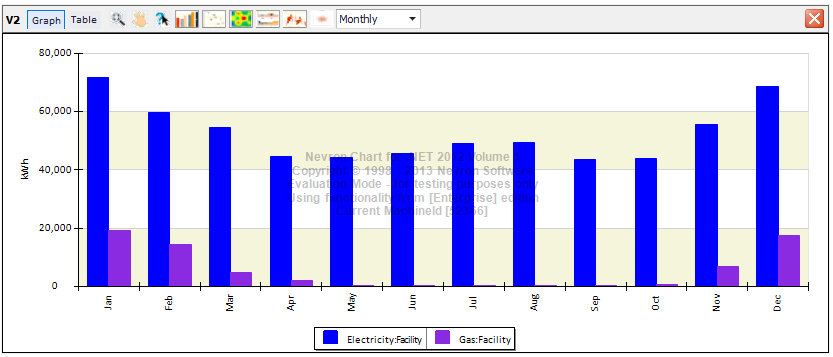
Results Visualization – Electrical and gas consumption
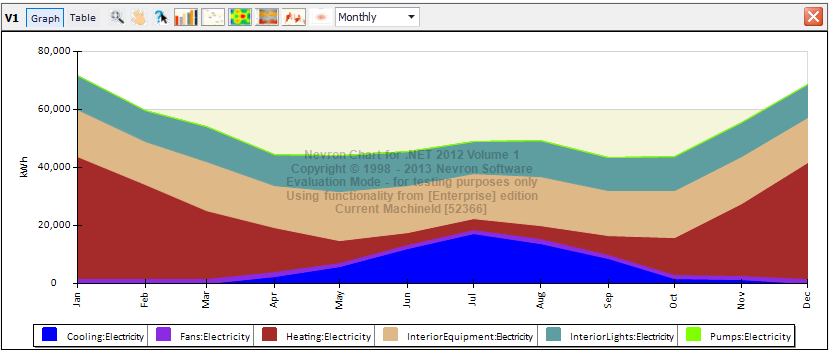
Results Visualization – Stacked area chart of various electricity consumers
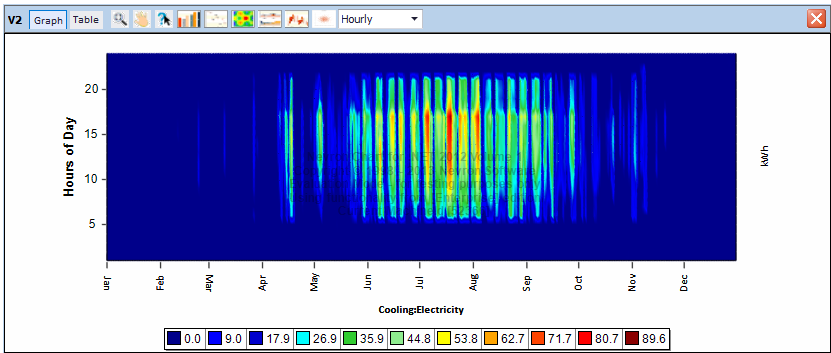
Results Visualization – Scatter chart of electric consumption for cooling