Workspace = Reports
Related Topics: Reports Features, Reports Toolbar
The Zone Summary report contains two main tables: 1) Zone Summary 2) Design Day: Zone Cooling (1%) and Heating (99%).
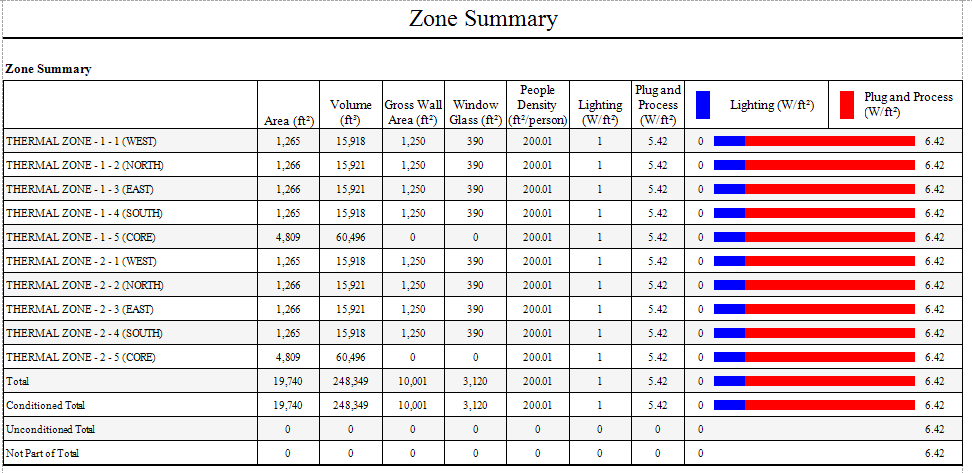
Zone Summary Table
Were all the thermal zones included?
Do the sizes of the thermal zones seem correct?
Do the window areas for the thermal zones seem correct?
Are the internal loads (Lighting and Plug and Process Loads) assigned to the thermal zones correct?
Are the internal loads consistent across the thermal zones or varying as they should be?
Design Day: Zone Cooling (1%) and Heating (99%) Table
Do the Calculated Design loads for the different thermal zones seem reasonable?
Do the User Design Load values align with the sizing factors that were included?
Does the Design Air Flow rates seem reasonable for the thermal zones?
Do the User Design Air Flow rates align with the sizing factors that were included?
Do the peak dates, times, external temperatures and humidity ratio seem reasonable?
Looking at the graph which thermal zone loads jump out and should be investigated further?
The table contains a line item for each thermal zone and contains information on the physical characteristics of the zone, the envelope of the thermal zone and the internal loads. The totals provide feedback on the overall total, as well as the conditioned and unconditioned totals of the thermal zones. On the right side of the table is a stacked bar chart that shows the total internal loads for each thermal zone and the contribution related to Lighting and Plug and Process.
The table contains two rows for each thermal zone that was included in the simulation. The first row identifies the results for Cooling and the second row for
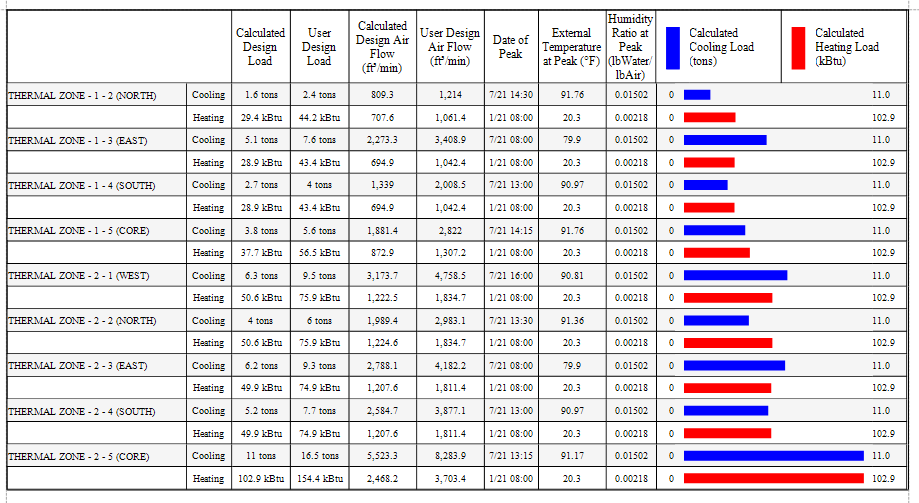
The resulting design load (cooling or heating) from the Simergy simulation based on the inputs included in the model.
The total of the Calculated Design Load multiplied by the sizing factors included in the model. See Design Calculations and Libraries > Sizing Params for additional information.
The resulting design air flow (cooling or heating) from the Simergy simulation based on the inputs included in the model.
The total of the Calculated Design Load multiplied by the sizing factors included in the model. See Design Air Flow Rates and Libraries > Sizing Params for additional information.
The date and time during the simulation period (year, set of days, etc) when the Design Load Peak for cooling or heating occurred.
The external temperature at the date and time the Peak Design Load occurred.
The Humidity Ratio at the date and time the Peak Design Load occurred.
A bar graph for each row providing a visual representation of the Design Load value. Two values are also included in this area. The first is the Design Load on the left, which is the number that is being graphically displayed. The value on the right side is the peak design load for the peak thermal zone of the set.
______________________________________________________________________________________
© Copyright 2013 Simergy, Sustainable IQ, Inc.