Workspace = Reports
Related Topics: Reports Features, Reports Toolbar
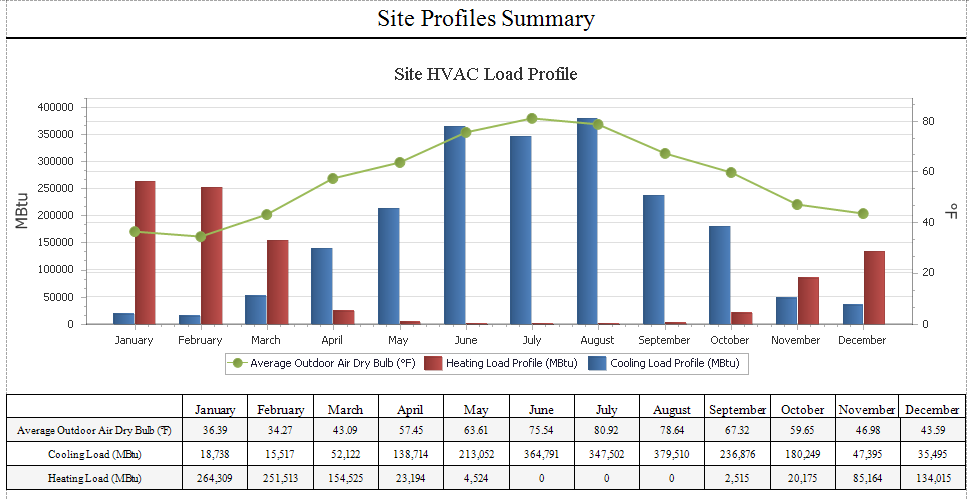
The Site Profile Summary Report contains two main sections:
Site HVAC Load Profile
Site HVAC Hourly Load Distribution
The Site HVAC Load Profile displays the same set of data visually and in a table format. The Average Outdoor Air Dry Bulb Temperature is plotted as a line graph, while the Heating and Cooling Loads are displayed as a columns.
The monthly average outdoor dry bulb temperature that is obtained from the location weather file.
The monthly cooling load that is required to maintain the targeted setpoint settings included in the model.
The monthly heating load that is required to maintain the targeted setpoint settings included in the model.
Illustrates details on how the heating and cooling loads are distributed. The graph shows the percentage of hours in cooling and heating over 5% load bins. The table shows how many hours of cooling and heating are in specific load bins.
______________________________________________________________________________________
© Copyright 2013 Simergy, Sustainable IQ, Inc.