Workspace = Reports
Related Topics: Reports Features, Reports Toolbar
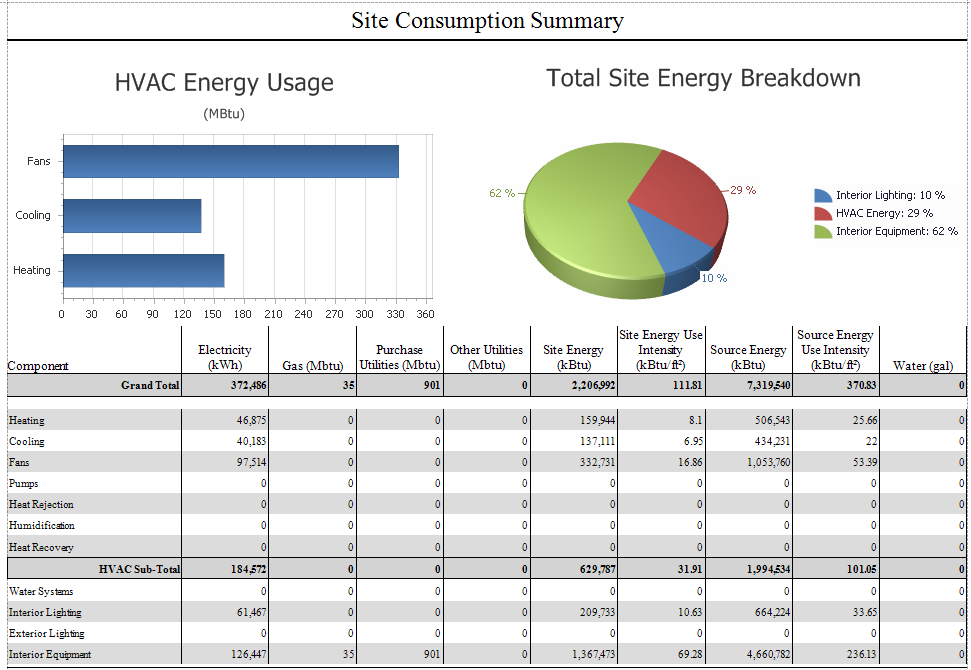
The report provides two graphs at the top of the report showing HVAC Energy Use (bar chart) and the Total Site Energy Breakdown (Pie Chart). Below the pair of graphs is a table that provides the breakdown and totals for energy end uses, as well as a HVAC sub-total.
The components listed in the first column display results in each of the following column categories, if inputs are included in the model that result in consumption.
The amount of energy consumed by the different end use components for the time period simulated.
The amount of gas consumed by the different end use components for the time period simulated.
District heating and cooling utilities
are the remaining utilities besides Electricity, Gas and District utilities
Energy used at Site
Energy Used at Site per floor area
Energy Used at the Source (including transmission losses)
Energy Used at the Source per floor area (including transmission losses)
The amount of water consumed by the different end use components for the time period simulated.
______________________________________________________________________________________
© Copyright 2013 Simergy, Sustainable IQ, Inc.