Workspace = Reports
Related Topics: Reports Features, Reports Toolbar
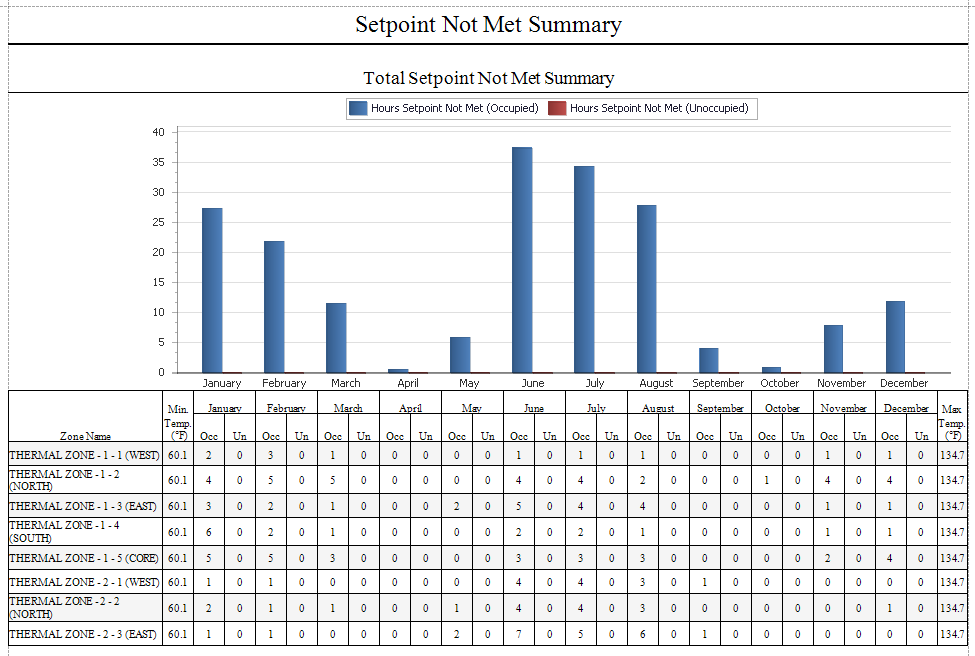
The Setpoint Not Met Summary Report contains three graph + table combinations:
Total Setpoint Not Met Summary
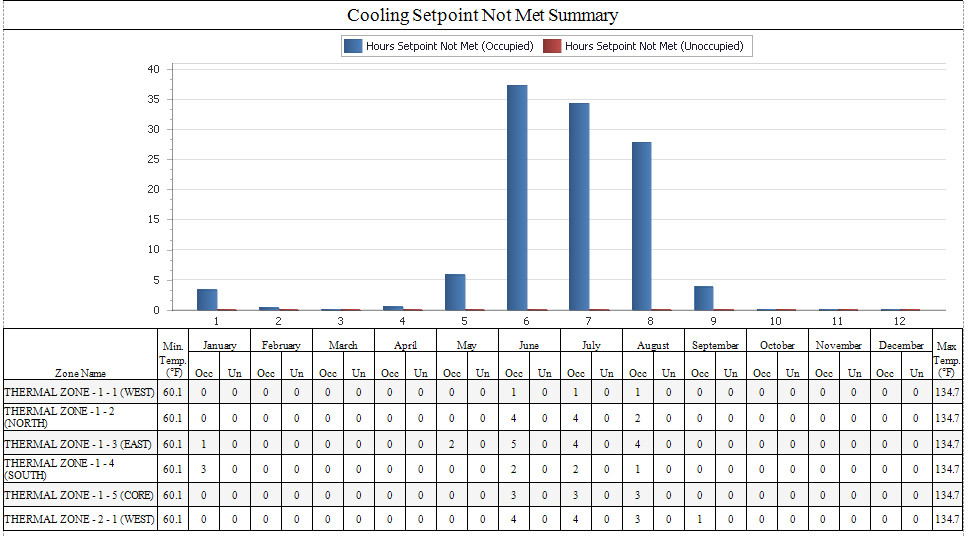
Cooling Setpoint Not Met Summary
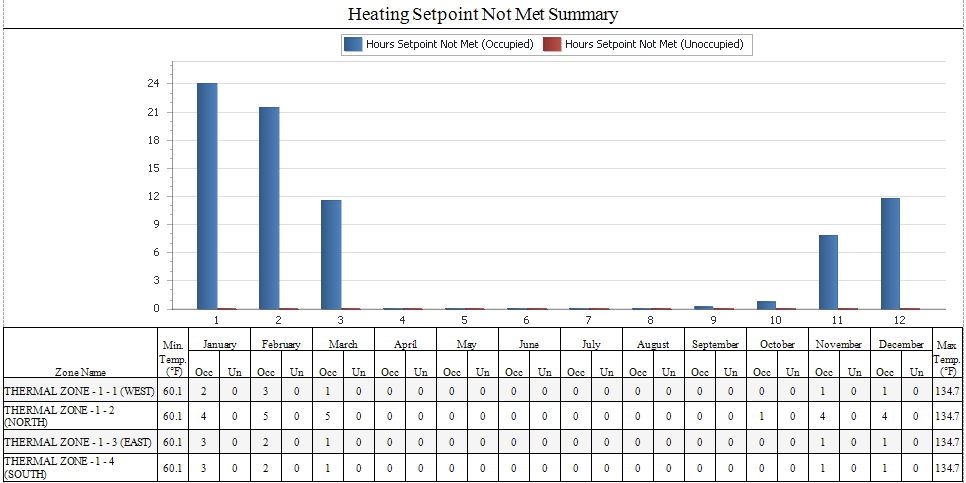
Heating Setpoint Not Met Summary
The column graph at the top displays the hours that the setpoint was not met for the month for occupied and unoccupied hours. The columns in the graph align with the columns of hours being reported in the table. The table below contains a row for each thermal zone that was simulated. On the left side there is a column identifying the minimum indoor temperature for the thermal zone during the simulated period. The column on the far right displays the maximum indoor temperature for the thermal zone during the simulated period. The main body of the table contains two columns for each month. "Occ" = occupied hours setpoint not met. "Un" = unoccupied hours setpoint not met. The last row in the table provides the total hours for all the thermal zones for that month and is the same value that is graphically displayed in the column graph.
Same composition as the Total Setpoint Not Met Summary graph + table combination. The only difference is that this one is focused on cooling versus Total.
Same composition as the Total Setpoint Not Met Summary graph + table combination. The only difference is that this one is focused on heating versus Total.
______________________________________________________________________________________
© Copyright 2013 Simergy, Sustainable IQ, Inc.